
- Start >
- Rivers >
- Discharge >
- Oberer Main - Elbe >
- Schönstädt >
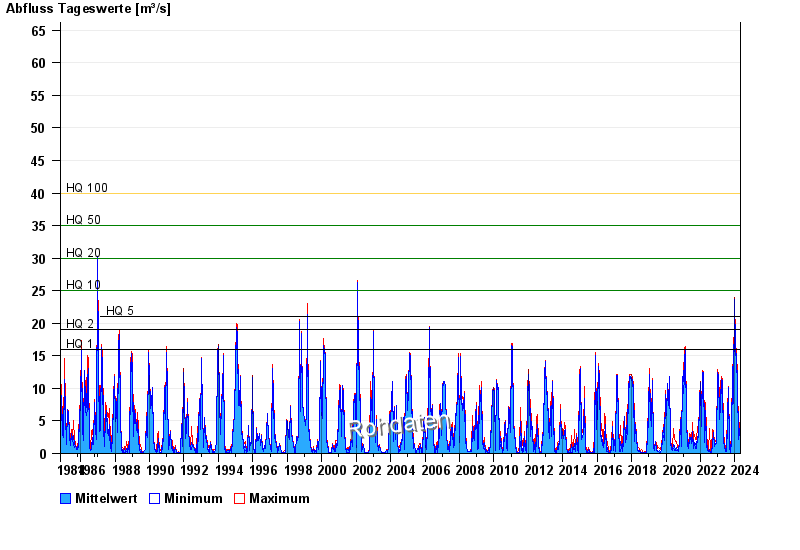
- Chart of total period

Chart of total period Schönstädt / Itz
Discharge from 01.11.1984 to 26.04.2024
note
Abfluss ohne Ausleitung über den ehemaligenTriebwerkskanal
- HQ1 16 m³/s
- HQ2 19 m³/s
- HQ5 21 m³/s
- HQ10 25 m³/s
- HQ20 30 m³/s
- HQ50 35 m³/s
- HQ100 40 m³/s
| Date | Mean value [m³/s] | Maximum [m³/s] | Minimum [m³/s] |
|---|---|---|---|
| 26.04.2024 | 3.61 | 3.61 | 3.61 |
| 25.04.2024 | 3.59 | 3.7 | 3.53 |
| 24.04.2024 | 3.52 | 3.61 | 3.45 |
| 23.04.2024 | 3.82 | 3.95 | 3.61 |
| 22.04.2024 | 4.14 | 4.38 | 3.95 |
| 21.04.2024 | 4.61 | 4.85 | 4.38 |
| 20.04.2024 | 4.52 | 4.66 | 4.29 |
© Bayerisches Landesamt für Umwelt 2024