
- Start >
- Rivers >
- Discharge >
- Oberer Main - Elbe >
- Schönbrunn >
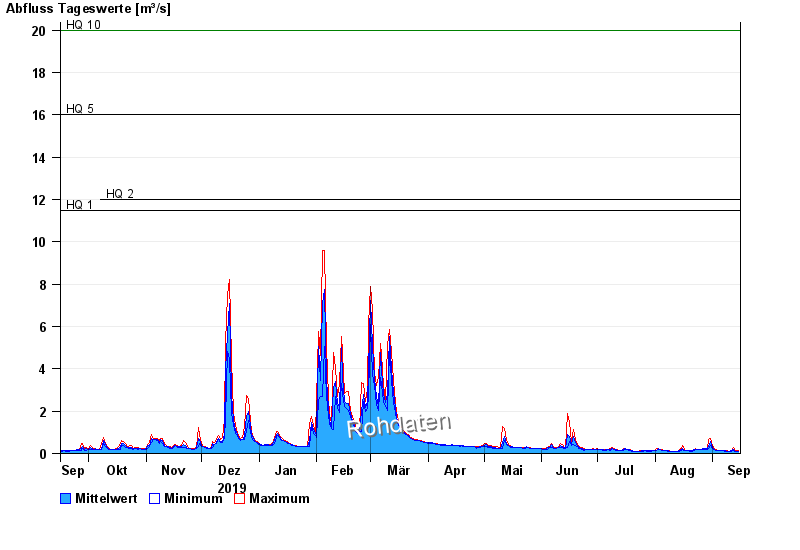
- Chart of year

Chart of year Schönbrunn / Rauhe Ebrach
Discharge from 16.09.2019 to 15.09.2020
note
Beeinflussung des Abflusses aufgrund Hindernisse im Unterlauf
- HQ1 11,5 m³/s
- HQ2 12 m³/s
- HQ5 16 m³/s
- HQ10 20 m³/s
- HQ20 24 m³/s
- HQ50 30 m³/s
- HQ100 36 m³/s
| Date | Mean value [m³/s] | Maximum [m³/s] | Minimum [m³/s] |
|---|---|---|---|
| 15.09.2020 | 0.098 | 0.121 | 0.077 |
| 14.09.2020 | 0.108 | 0.126 | 0.088 |
| 13.09.2020 | 0.112 | 0.157 | 0.089 |
| 12.09.2020 | 0.177 | 0.263 | 0.119 |
| 11.09.2020 | 0.123 | 0.126 | 0.107 |
| 10.09.2020 | 0.106 | 0.113 | 0.079 |
| 09.09.2020 | 0.116 | 0.119 | 0.113 |
© Bayerisches Landesamt für Umwelt 2024