
- Start >
- Rivers >
- Discharge >
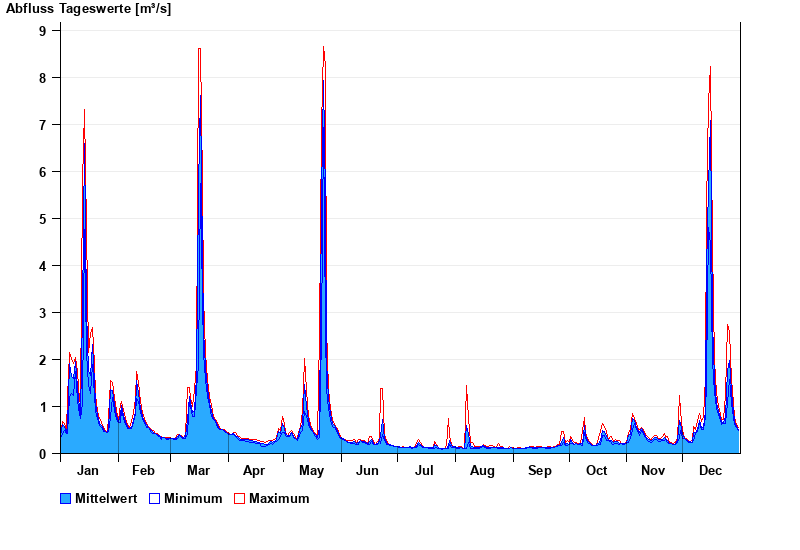
- Oberer Main - Elbe >
- Schönbrunn >
- Chart of year

Chart of year Schönbrunn / Rauhe Ebrach
Discharge from 01.01.2019 to 31.12.2019
note
Beeinflussung des Abflusses aufgrund Hindernisse im Unterlauf
| Date | Mean value [m³/s] | Maximum [m³/s] | Minimum [m³/s] |
|---|---|---|---|
| 31.12.2019 | 0.516 | 0.55 | 0.49 |
| 30.12.2019 | 0.578 | 0.61 | 0.55 |
| 29.12.2019 | 0.687 | 0.765 | 0.61 |
| 28.12.2019 | 0.883 | 1.06 | 0.765 |
| 27.12.2019 | 1.3 | 1.58 | 1.06 |
| 26.12.2019 | 1.98 | 2.58 | 1.58 |
| 25.12.2019 | 1.76 | 2.75 | 1.09 |
© Bayerisches Landesamt für Umwelt 2024