
- Start >
- Rivers >
- Discharge >
- Oberer Main - Elbe >
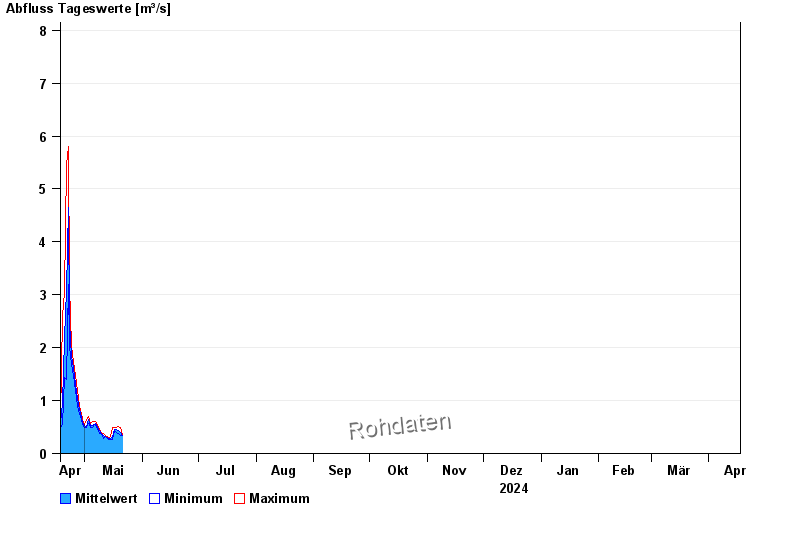
- Schönbrunn >
- Chart of year

Chart of year Schönbrunn / Rauhe Ebrach
Discharge from 18.04.2024 to 17.04.2025
note
Beeinflussung des Abflusses aufgrund Hindernisse im Unterlauf
- 02.03.1987 Abfluss: 29,9 m³/s
- 07.06.1984 Abfluss: 28,7 m³/s
- 26.01.1995 Abfluss: 26,1 m³/s
- 09.12.1981 Abfluss: 23,6 m³/s
- 31.05.2013 Abfluss: 22,6 m³/s
| Date | Mean value [m³/s] | Maximum [m³/s] | Minimum [m³/s] |
|---|---|---|---|
| 30.04.2024 | 0.599 | 0.636 | 0.546 |
| 29.04.2024 | 0.68 | 0.761 | 0.636 |
| 28.04.2024 | 0.823 | 0.888 | 0.761 |
| 27.04.2024 | 1.04 | 1.2 | 0.888 |
| 26.04.2024 | 1.3 | 1.48 | 1.2 |
| 25.04.2024 | 1.6 | 1.73 | 1.48 |
| 24.04.2024 | 1.84 | 2.03 | 1.69 |
© Bayerisches Landesamt für Umwelt 2024