
- Start >
- Rivers >
- Discharge >
- Oberer Main - Elbe >
- Schönbrunn >
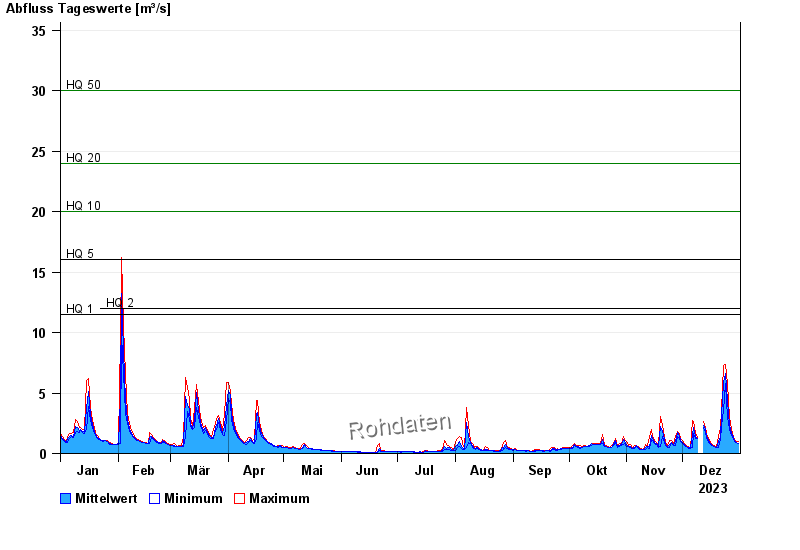
- Chart of year

Chart of year Schönbrunn / Rauhe Ebrach
Discharge from 01.01.2023 to 31.12.2023
note
Beeinflussung des Abflusses aufgrund Hindernisse im Unterlauf
- HQ1 11,5 m³/s
- HQ2 12 m³/s
- HQ5 16 m³/s
- HQ10 20 m³/s
- HQ20 24 m³/s
- HQ50 30 m³/s
- HQ100 36 m³/s
| Date | Mean value [m³/s] | Maximum [m³/s] | Minimum [m³/s] |
|---|---|---|---|
| 31.12.2023 | 0.842 | 0.951 | 0.792 |
| 30.12.2023 | 0.933 | 0.991 | 0.881 |
| 29.12.2023 | 1.05 | 1.17 | 0.951 |
| 28.12.2023 | 1.3 | 1.44 | 1.17 |
| 27.12.2023 | 1.67 | 2 | 1.48 |
| 26.12.2023 | 2.43 | 3.01 | 2 |
| 25.12.2023 | 4.28 | 5.81 | 3.01 |
© Bayerisches Landesamt für Umwelt 2024