
- Start >
- Rivers >
- Discharge >
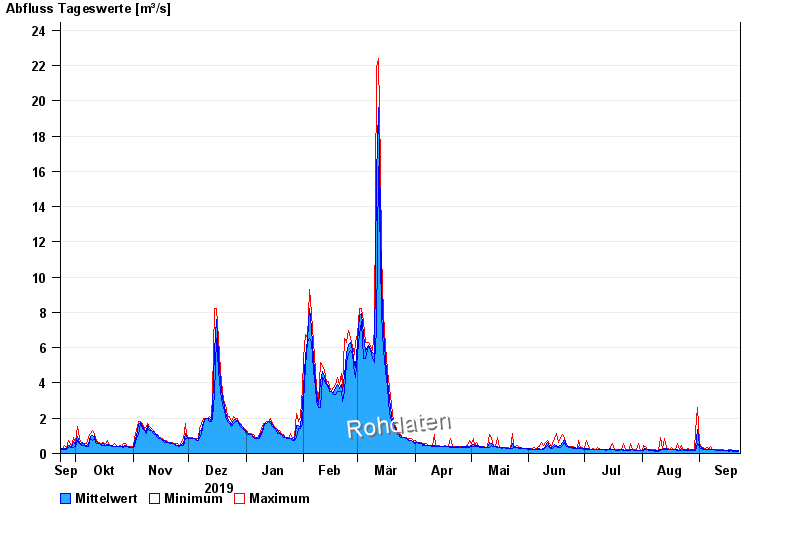
- Oberer Main - Elbe >
- Rieblich >
- Chart of year

Chart of year Rieblich / Rodach
Discharge from 23.09.2019 to 22.09.2020
| Date | Mean value [m³/s] | Maximum [m³/s] | Minimum [m³/s] |
|---|---|---|---|
| 22.09.2020 | 0.163 | 0.165 | 0.135 |
| 21.09.2020 | 0.16 | 0.165 | 0.135 |
| 20.09.2020 | 0.162 | 0.165 | 0.135 |
| 19.09.2020 | 0.164 | 0.165 | 0.135 |
| 18.09.2020 | 0.165 | 0.2 | 0.165 |
| 17.09.2020 | 0.165 | 0.2 | 0.135 |
| 16.09.2020 | 0.165 | 0.165 | 0.165 |
© Bayerisches Landesamt für Umwelt 2024