
- Start >
- Rivers >
- Discharge >
- Oberer Main - Elbe >
- Rieblich >
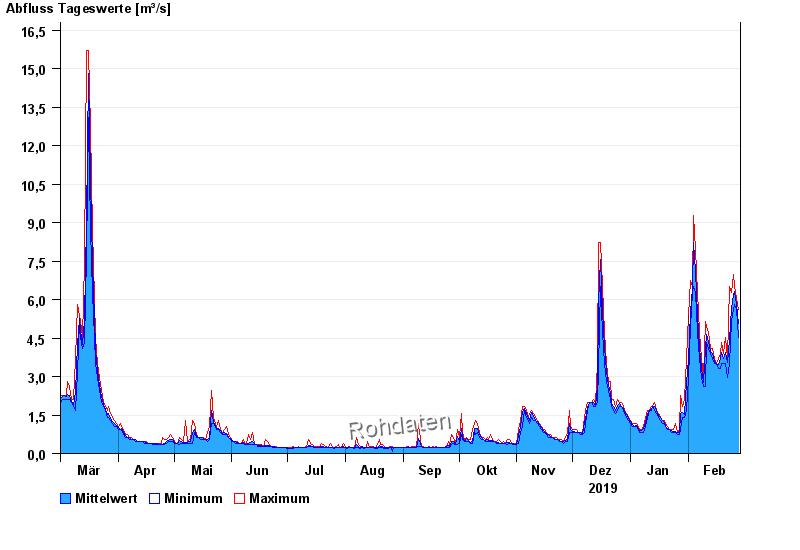
- Chart of year

Chart of year Rieblich / Rodach
Discharge from 01.03.2019 to 28.02.2020
| Date | Mean value [m³/s] | Maximum [m³/s] | Minimum [m³/s] |
|---|---|---|---|
| 28.02.2020 | 5.06 | 5.6 | 4.52 |
| 27.02.2020 | 5.82 | 6.05 | 5.6 |
| 26.02.2020 | 6.32 | 6.51 | 5.82 |
| 25.02.2020 | 6.2 | 6.98 | 5.6 |
| 24.02.2020 | 5.66 | 6.28 | 5.16 |
| 23.02.2020 | 4.44 | 6.51 | 3.52 |
| 22.02.2020 | 3.53 | 3.72 | 2.96 |
© Bayerisches Landesamt für Umwelt 2024