
- Start >
- Rivers >
- Discharge >
- Oberer Main - Elbe >
- Rappoldshofen >
- Chart of total period

Chart of total period Rappoldshofen / Aisch
Discharge from 01.11.1968 to 04.05.2024
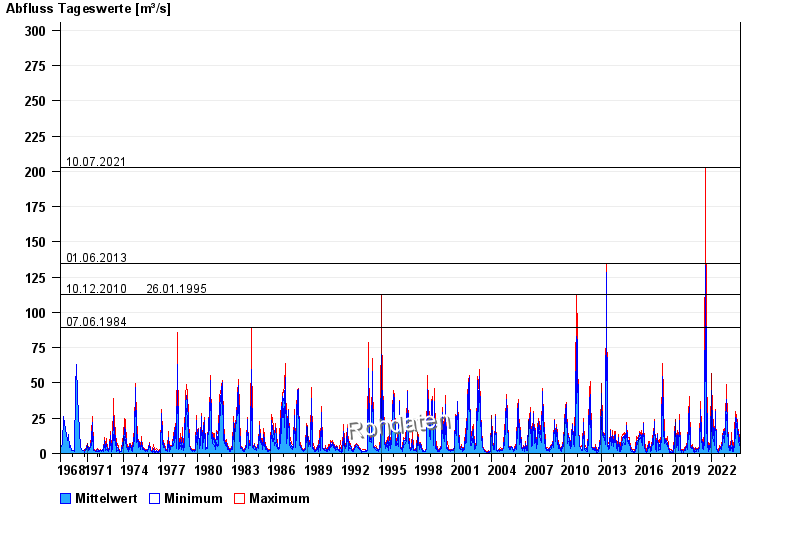
- 10.07.2021 Abfluss: 203 m³/s
- 01.06.2013 Abfluss: 135 m³/s
- 10.12.2010 Abfluss: 113 m³/s
- 26.01.1995 Abfluss: 113 m³/s
- 07.06.1984 Abfluss: 89 m³/s
| Date | Mean value [m³/s] | Maximum [m³/s] | Minimum [m³/s] |
|---|---|---|---|
| 04.05.2024 | 13.5 | 16.9 | 8.63 |
| 03.05.2024 | 14.3 | 17.1 | 4.83 |
| 02.05.2024 | 2.37 | 4.55 | 1.74 |
| 01.05.2024 | 2.25 | 2.55 | 1.85 |
| 30.04.2024 | 2.45 | 2.55 | 2.43 |
| 29.04.2024 | 2.54 | 2.68 | 2.31 |
| 28.04.2024 | 2.76 | 2.94 | 2.68 |
© Bayerisches Landesamt für Umwelt 2024