
- Start >
- Rivers >
- Discharge >
- Oberer Main - Elbe >
- Plankenfels >
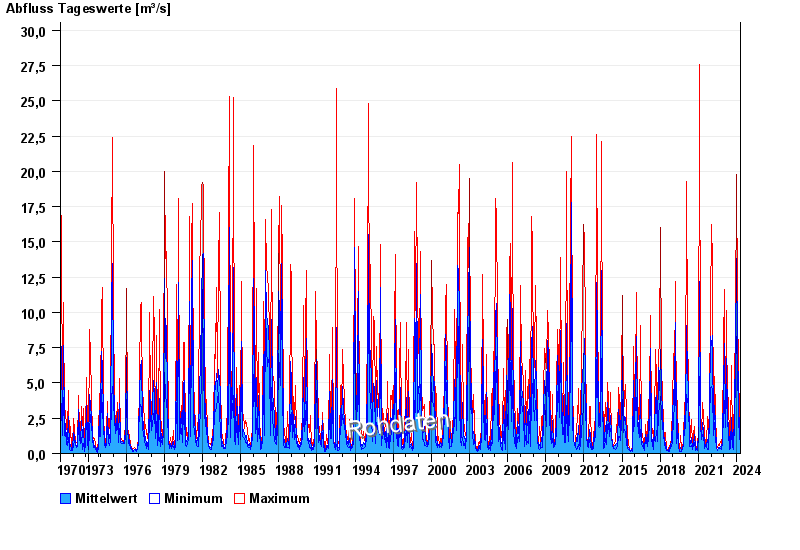
- Chart of total period

Chart of total period Plankenfels / Truppach
Discharge from 01.11.1970 to 26.04.2024
| Date | Mean value [m³/s] | Maximum [m³/s] | Minimum [m³/s] |
|---|---|---|---|
| 26.04.2024 | 1.5 | 1.53 | 1.47 |
| 25.04.2024 | 1.47 | 1.64 | 1.36 |
| 24.04.2024 | 1.52 | 1.64 | 1.41 |
| 23.04.2024 | 1.89 | 2.35 | 1.64 |
| 22.04.2024 | 3.47 | 6.32 | 2.35 |
| 21.04.2024 | 3.33 | 6.32 | 1.47 |
| 20.04.2024 | 2.06 | 2.91 | 1.64 |
© Bayerisches Landesamt für Umwelt 2024