
- Start >
- Rivers >
- Discharge >
- Oberer Main - Elbe >
- Pfarrweisach >
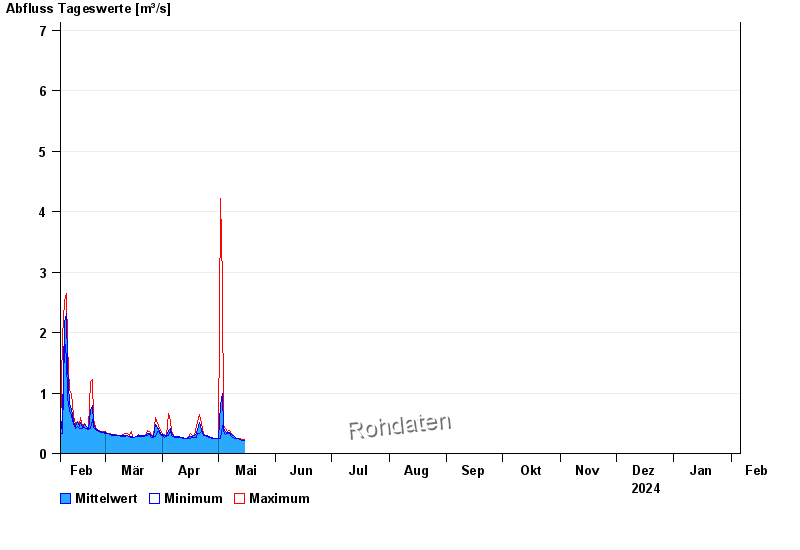
- Chart of year

Chart of year Pfarrweisach / Weisach
Discharge from 06.02.2024 to 05.02.2025
- 23.01.1995 Abfluss: 28,8 m³/s
- 08.12.1981 Abfluss: 17,6 m³/s
- 12.04.2008 Abfluss: 16,8 m³/s
- 05.01.1982 Abfluss: 16,5 m³/s
- 01.04.1988 Abfluss: 15,8 m³/s
| Date | Mean value [m³/s] | Maximum [m³/s] | Minimum [m³/s] |
|---|---|---|---|
| 15.05.2024 | 0.221 | 0.226 | 0.211 |
| 14.05.2024 | 0.223 | 0.226 | 0.211 |
| 13.05.2024 | 0.239 | 0.241 | 0.226 |
| 12.05.2024 | 0.241 | 0.241 | 0.241 |
| 11.05.2024 | 0.254 | 0.256 | 0.241 |
| 10.05.2024 | 0.268 | 0.272 | 0.256 |
| 09.05.2024 | 0.299 | 0.305 | 0.272 |
© Bayerisches Landesamt für Umwelt 2024