
- Start >
- Rivers >
- Discharge >
- Oberer Main - Elbe >
- Pfarrweisach >
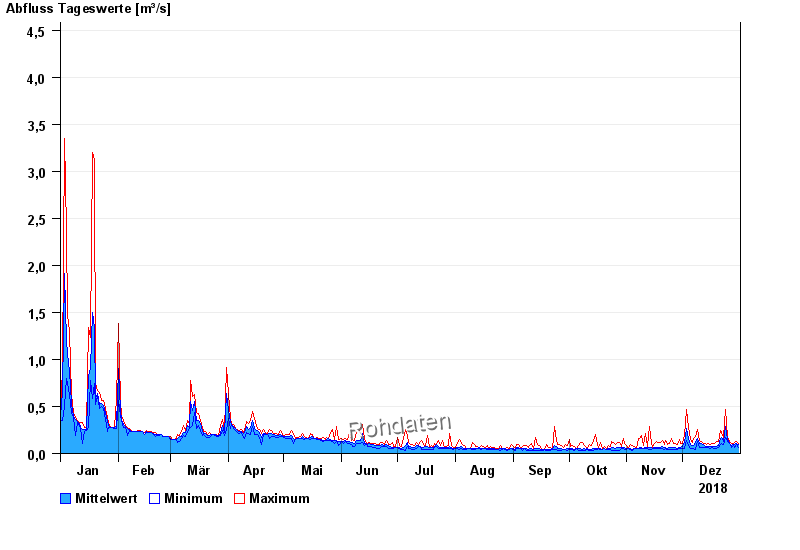
- Chart of year

Chart of year Pfarrweisach / Weisach
Discharge from 01.01.2018 to 31.12.2018
- 23.01.1995 Abfluss: 28,8 m³/s
- 08.12.1981 Abfluss: 17,6 m³/s
- 12.04.2008 Abfluss: 16,8 m³/s
- 05.01.1982 Abfluss: 16,5 m³/s
- 01.04.1988 Abfluss: 15,8 m³/s
| Date | Mean value [m³/s] | Maximum [m³/s] | Minimum [m³/s] |
|---|---|---|---|
| 31.12.2018 | 0.091 | 0.105 | 0.061 |
| 30.12.2018 | 0.106 | 0.126 | 0.095 |
| 29.12.2018 | 0.095 | 0.116 | 0.069 |
| 28.12.2018 | 0.096 | 0.105 | 0.086 |
| 27.12.2018 | 0.09 | 0.105 | 0.061 |
| 26.12.2018 | 0.11 | 0.126 | 0.105 |
| 25.12.2018 | 0.149 | 0.186 | 0.126 |
© Bayerisches Landesamt für Umwelt 2024