
- Start >
- Rivers >
- Discharge >
- Oberer Main - Elbe >
- Pfarrweisach >
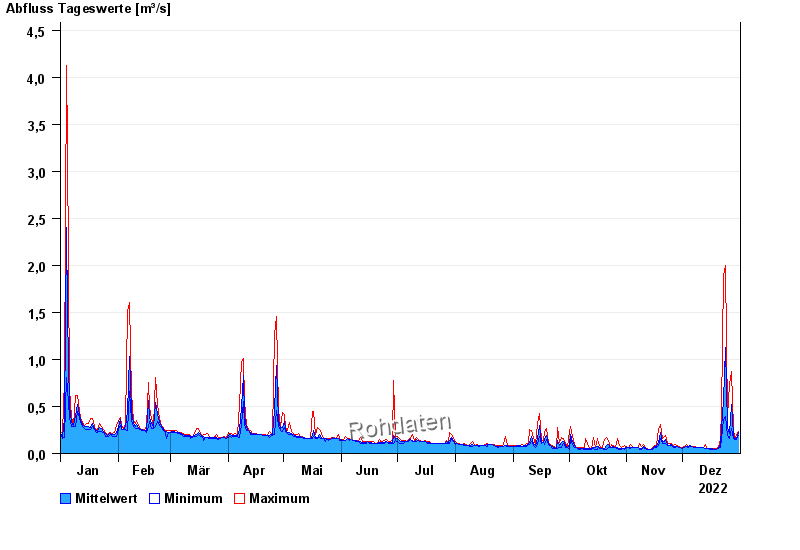
- Chart of year

Chart of year Pfarrweisach / Weisach
Discharge from 01.01.2022 to 31.12.2022
| Date | Mean value [m³/s] | Maximum [m³/s] | Minimum [m³/s] |
|---|---|---|---|
| 31.12.2022 | 0.224 | 0.239 | 0.195 |
| 30.12.2022 | 0.156 | 0.195 | 0.144 |
| 29.12.2022 | 0.147 | 0.156 | 0.144 |
| 28.12.2022 | 0.204 | 0.271 | 0.156 |
| 27.12.2022 | 0.518 | 0.875 | 0.271 |
| 26.12.2022 | 0.21 | 0.73 | 0.156 |
| 25.12.2022 | 0.278 | 0.395 | 0.195 |
© Bayerisches Landesamt für Umwelt 2025