
- Start >
- Rivers >
- Discharge >
- Oberer Main - Elbe >
- Oberlauter >
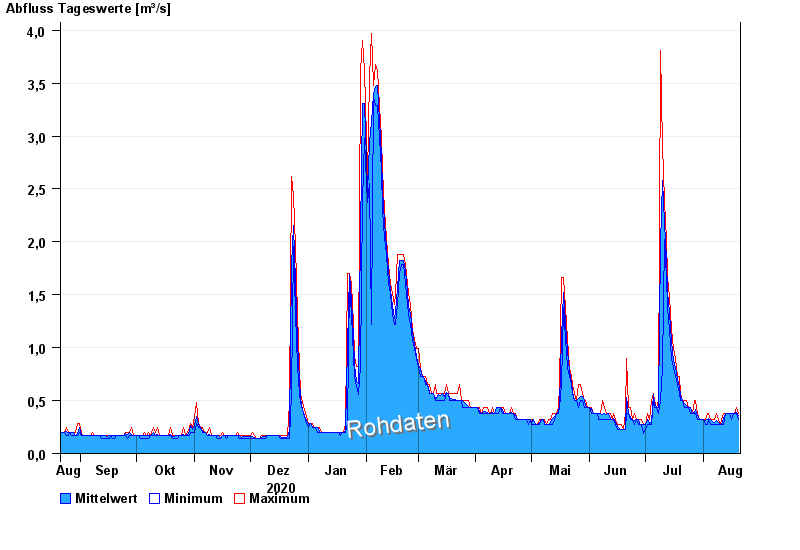
- Chart of year

Chart of year Oberlauter / Lauterbach
Discharge from 21.08.2020 to 20.08.2021
| Date | Mean value [m³/s] | Maximum [m³/s] | Minimum [m³/s] |
|---|---|---|---|
| 20.08.2021 | 0.36 | 0.382 | 0.326 |
| 19.08.2021 | 0.383 | 0.439 | 0.382 |
| 18.08.2021 | 0.382 | 0.382 | 0.382 |
| 17.08.2021 | 0.382 | 0.382 | 0.382 |
| 16.08.2021 | 0.38 | 0.382 | 0.326 |
| 15.08.2021 | 0.382 | 0.382 | 0.382 |
| 14.08.2021 | 0.382 | 0.382 | 0.382 |
© Bayerisches Landesamt für Umwelt 2024