
- Start >
- Rivers >
- Discharge >
- Oberer Main - Elbe >
- Oberlauter >
- Chart of year

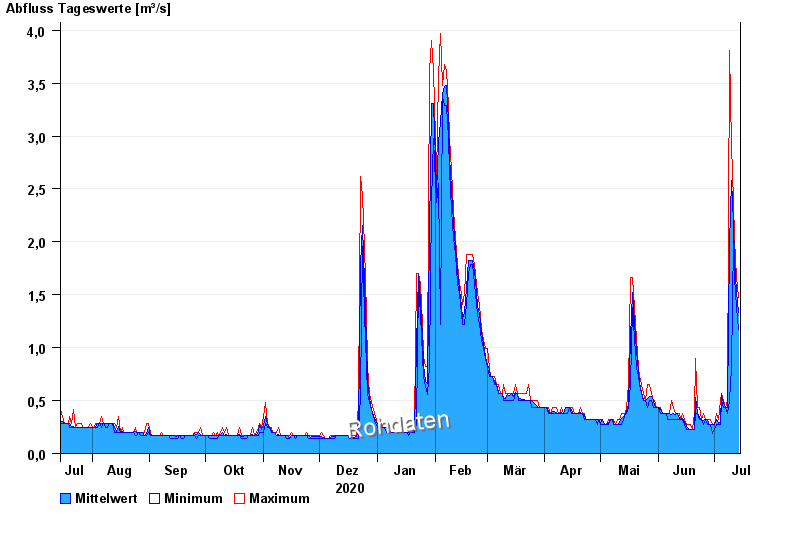
Chart of year Oberlauter / Lauterbach
Discharge from 15.07.2020 to 14.07.2021
| Date | Mean value [m³/s] | Maximum [m³/s] | Minimum [m³/s] |
|---|---|---|---|
| 14.07.2021 | 1.33 | 1.47 | 1.17 |
| 13.07.2021 | 1.52 | 1.66 | 1.38 |
| 12.07.2021 | 1.83 | 2.02 | 1.66 |
| 11.07.2021 | 2.18 | 2.38 | 2.02 |
| 10.07.2021 | 2.58 | 2.91 | 0.816 |
| 09.07.2021 | 1.98 | 3.81 | 0.498 |
| 08.07.2021 | 0.43 | 0.498 | 0.382 |
© Bayerisches Landesamt für Umwelt 2024