
- Start >
- Rivers >
- Discharge >
- Oberer Main - Elbe >
- Oberlauter >
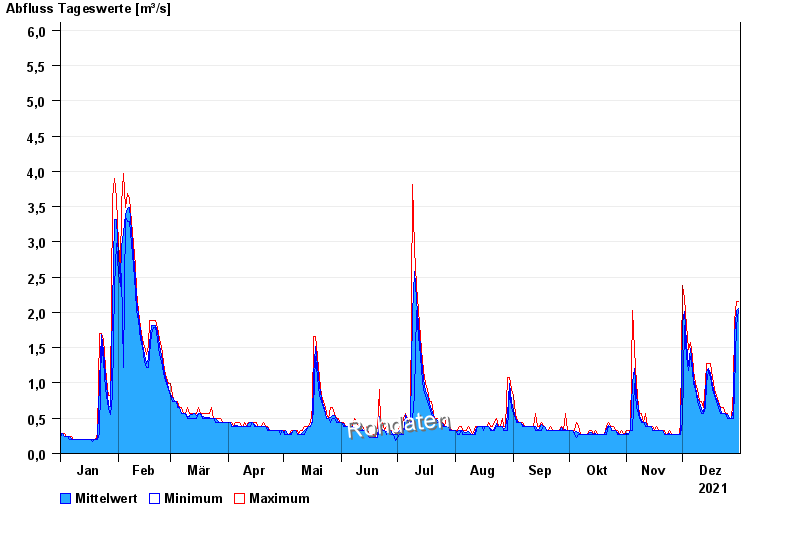
- Chart of year

Chart of year Oberlauter / Lauterbach
Discharge from 01.01.2021 to 31.12.2021
- 02.01.2003 Abfluss: 14,1 m³/s
- 12.02.2005 Abfluss: 13 m³/s
- 06.01.1982 Abfluss: 10,1 m³/s
- 27.01.2002 Abfluss: 9,96 m³/s
- 30.12.1986 Abfluss: 9,89 m³/s
| Date | Mean value [m³/s] | Maximum [m³/s] | Minimum [m³/s] |
|---|---|---|---|
| 31.12.2021 | 2.06 | 2.15 | 2.02 |
| 30.12.2021 | 2.03 | 2.15 | 1.82 |
| 29.12.2021 | 1.67 | 1.89 | 0.902 |
| 28.12.2021 | 0.625 | 0.902 | 0.498 |
| 27.12.2021 | 0.498 | 0.498 | 0.498 |
| 26.12.2021 | 0.498 | 0.498 | 0.498 |
| 25.12.2021 | 0.548 | 0.568 | 0.498 |
© Bayerisches Landesamt für Umwelt 2024