
- Start >
- Rivers >
- Discharge >
- Oberer Main - Elbe >
- Oberlauter >
- Chart of year

Chart of year Oberlauter / Lauterbach
Discharge from 30.03.2024 to 29.03.2025
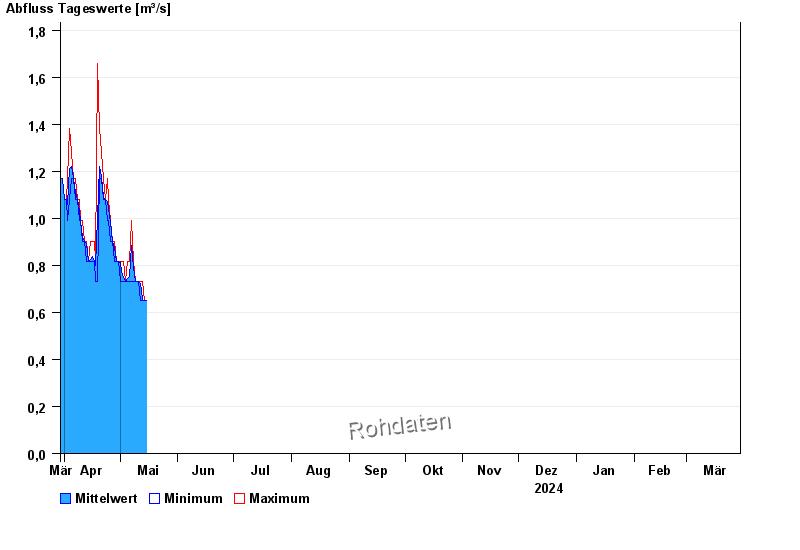
| Date | Mean value [m³/s] | Maximum [m³/s] | Minimum [m³/s] |
|---|---|---|---|
| 31.05.2024 | 0.775 | 0.816 | 0.732 |
| 30.05.2024 | 0.742 | 0.902 | 0.651 |
| 29.05.2024 | 0.651 | 0.651 | 0.651 |
| 28.05.2024 | 0.764 | 0.816 | 0.651 |
| 27.05.2024 | 0.816 | 0.816 | 0.816 |
| 26.05.2024 | 0.845 | 0.902 | 0.816 |
| 25.05.2024 | 0.922 | 0.991 | 0.902 |
© Bayerisches Landesamt für Umwelt 2024