
- Start >
- Rivers >
- Discharge >
- Oberer Main - Elbe >
- Oberlauter >
- Chart of year

Chart of year Oberlauter / Lauterbach
Discharge from 01.01.2023 to 31.12.2023
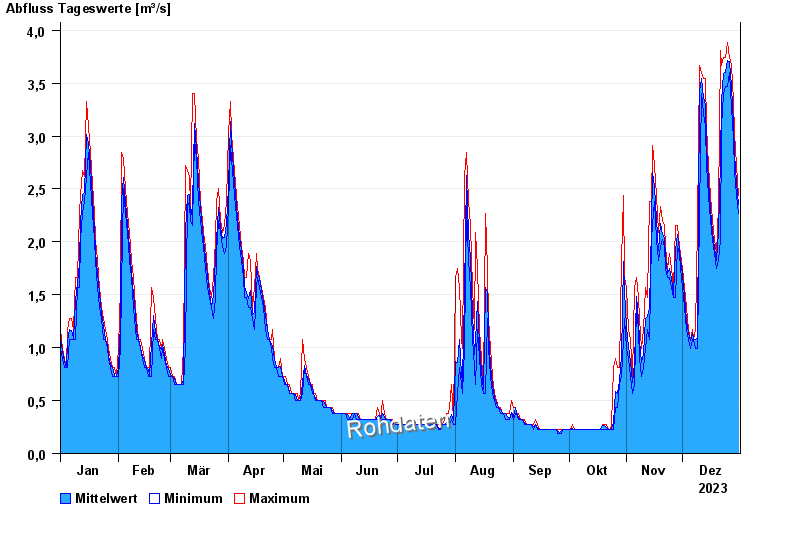
| Date | Mean value [m³/s] | Maximum [m³/s] | Minimum [m³/s] |
|---|---|---|---|
| 31.12.2023 | 2.35 | 2.44 | 2.27 |
| 30.12.2023 | 2.56 | 2.72 | 2.44 |
| 29.12.2023 | 2.83 | 3.02 | 2.67 |
| 28.12.2023 | 3.12 | 3.33 | 2.97 |
| 27.12.2023 | 3.47 | 3.67 | 3.27 |
| 26.12.2023 | 3.7 | 3.74 | 3.6 |
| 25.12.2023 | 3.71 | 3.88 | 3.47 |
© Bayerisches Landesamt für Umwelt 2024