
- Start >
- Rivers >
- Discharge >
- Oberer Main - Elbe >
- Oberlauter >
- Chart of year

Chart of year Oberlauter / Lauterbach
Discharge from 29.09.2020 to 28.09.2021
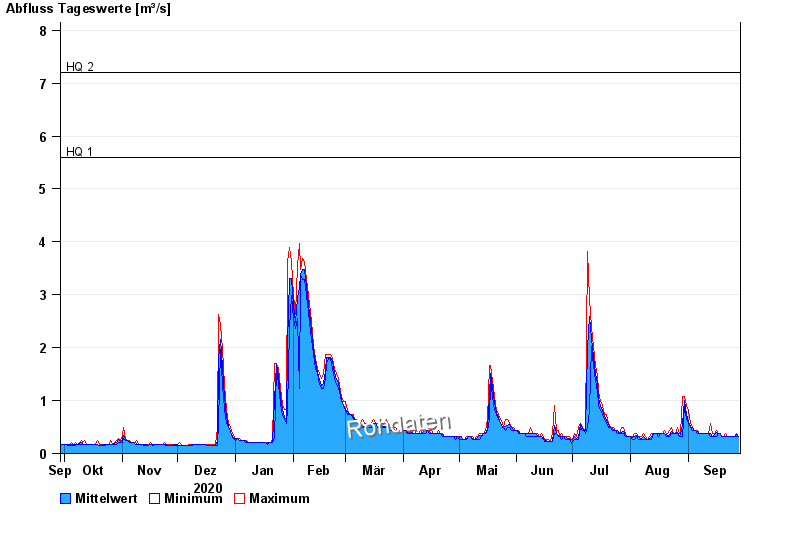
- HQ1 5,6 m³/s
- HQ2 7,2 m³/s
- HQ5 9,4 m³/s
- HQ10 11,3 m³/s
- HQ20 13,2 m³/s
- HQ50 16,1 m³/s
- HQ100 18,5 m³/s
| Date | Mean value [m³/s] | Maximum [m³/s] | Minimum [m³/s] |
|---|---|---|---|
| 28.09.2021 | 0.326 | 0.326 | 0.326 |
| 27.09.2021 | 0.366 | 0.382 | 0.326 |
| 26.09.2021 | 0.326 | 0.326 | 0.326 |
| 25.09.2021 | 0.326 | 0.326 | 0.326 |
| 24.09.2021 | 0.326 | 0.326 | 0.326 |
| 23.09.2021 | 0.326 | 0.326 | 0.326 |
| 22.09.2021 | 0.326 | 0.326 | 0.326 |
© Bayerisches Landesamt für Umwelt 2024