
- Start >
- Rivers >
- Discharge >
- Oberer Main - Elbe >
- Oberlauter >
- Chart of year

Chart of year Oberlauter / Lauterbach
Discharge from 20.09.2019 to 19.09.2020
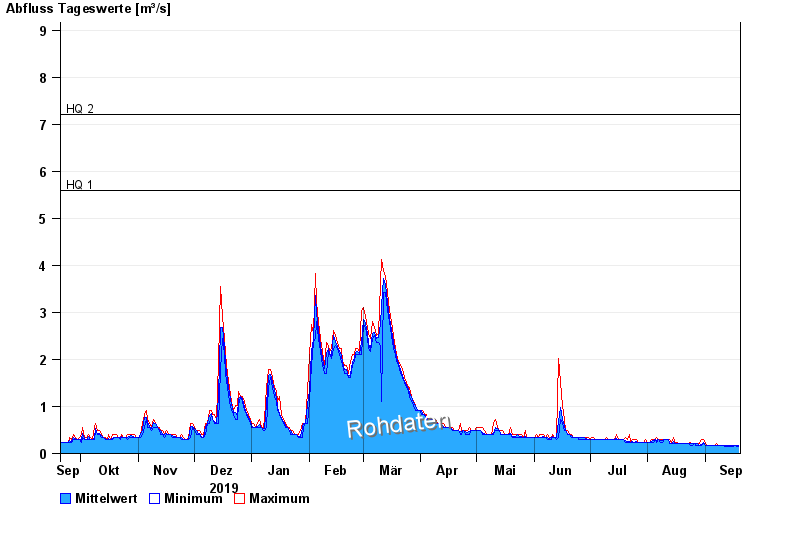
- HQ1 5,6 m³/s
- HQ2 7,2 m³/s
- HQ5 9,4 m³/s
- HQ10 11,3 m³/s
- HQ20 13,2 m³/s
- HQ50 16,1 m³/s
- HQ100 18,5 m³/s
| Date | Mean value [m³/s] | Maximum [m³/s] | Minimum [m³/s] |
|---|---|---|---|
| 19.09.2020 | 0.17 | 0.171 | 0.143 |
| 18.09.2020 | 0.171 | 0.171 | 0.143 |
| 17.09.2020 | 0.171 | 0.171 | 0.171 |
| 16.09.2020 | 0.171 | 0.171 | 0.143 |
| 15.09.2020 | 0.164 | 0.171 | 0.143 |
| 14.09.2020 | 0.17 | 0.171 | 0.143 |
| 13.09.2020 | 0.17 | 0.171 | 0.143 |
© Bayerisches Landesamt für Umwelt 2024