
- Start >
- Rivers >
- Discharge >
- Oberer Main - Elbe >
- Oberlauter >
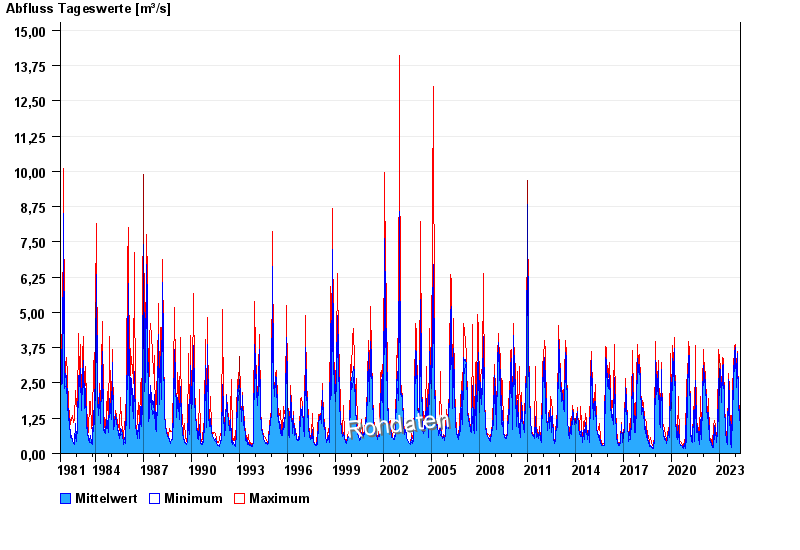
- Chart of total period

Chart of total period Oberlauter / Lauterbach
Discharge from 01.11.1981 to 26.04.2024
| Date | Mean value [m³/s] | Maximum [m³/s] | Minimum [m³/s] |
|---|---|---|---|
| 26.04.2024 | 0.991 | 0.991 | 0.991 |
| 25.04.2024 | 1.04 | 1.08 | 0.991 |
| 24.04.2024 | 1.07 | 1.17 | 0.991 |
| 23.04.2024 | 1.08 | 1.08 | 1.08 |
| 22.04.2024 | 1.09 | 1.17 | 1.08 |
| 21.04.2024 | 1.18 | 1.28 | 1.17 |
| 20.04.2024 | 1.22 | 1.38 | 1.17 |
© Bayerisches Landesamt für Umwelt 2024