
- Start >
- Rivers >
- Discharge >
- Oberer Main - Elbe >
- Oberhammer >
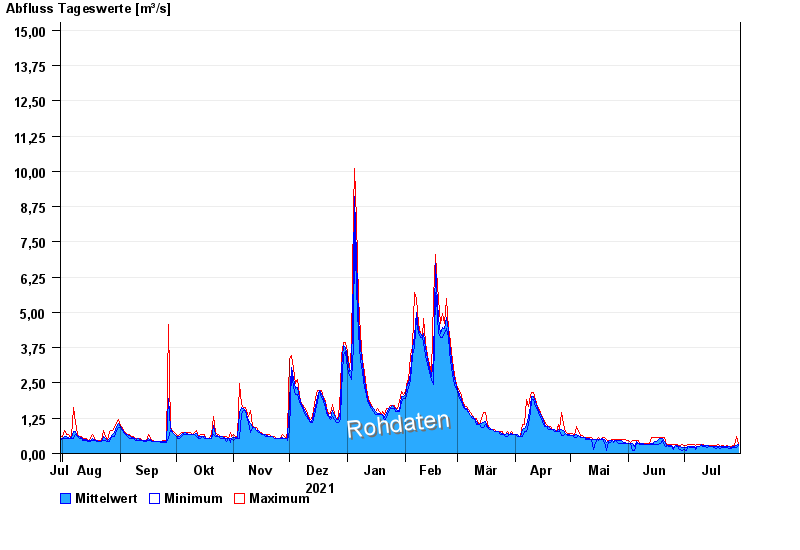
- Chart of year

Chart of year Oberhammer / Untere Steinach
Discharge from 31.07.2021 to 30.07.2022
- 24.12.1967 Abfluss: 26,6 m³/s
- 28.01.2002 Abfluss: 21,4 m³/s
- 10.03.1981 Abfluss: 21,1 m³/s
- 30.12.1986 Abfluss: 20,1 m³/s
- 01.11.1998 Abfluss: 19,5 m³/s
| Date | Mean value [m³/s] | Maximum [m³/s] | Minimum [m³/s] |
|---|---|---|---|
| 30.07.2022 | 0.31 | 0.369 | 0.285 |
| 29.07.2022 | 0.297 | 0.59 | 0.217 |
| 28.07.2022 | 0.238 | 0.285 | 0.217 |
| 27.07.2022 | 0.244 | 0.285 | 0.217 |
| 26.07.2022 | 0.227 | 0.249 | 0.189 |
| 25.07.2022 | 0.231 | 0.249 | 0.189 |
| 24.07.2022 | 0.241 | 0.285 | 0.217 |
© Bayerisches Landesamt für Umwelt 2024