
- Start >
- Rivers >
- Discharge >
- Oberer Main - Elbe >
- Oberhammer >
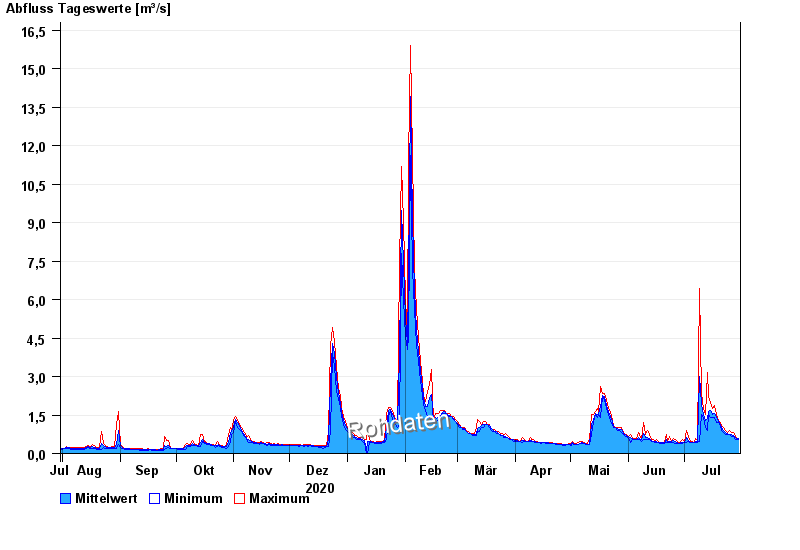
- Chart of year

Chart of year Oberhammer / Untere Steinach
Discharge from 31.07.2020 to 30.07.2021
| Date | Mean value [m³/s] | Maximum [m³/s] | Minimum [m³/s] |
|---|---|---|---|
| 30.07.2021 | 0.568 | 0.596 | 0.533 |
| 29.07.2021 | 0.593 | 0.596 | 0.533 |
| 28.07.2021 | 0.645 | 0.739 | 0.596 |
| 27.07.2021 | 0.701 | 0.817 | 0.665 |
| 26.07.2021 | 0.744 | 0.817 | 0.665 |
| 25.07.2021 | 0.756 | 0.904 | 0.739 |
| 24.07.2021 | 0.771 | 0.817 | 0.739 |
© Bayerisches Landesamt für Umwelt 2024