
- Start >
- Rivers >
- Discharge >
- Oberer Main - Elbe >
- Oberhammer >
- Chart of year

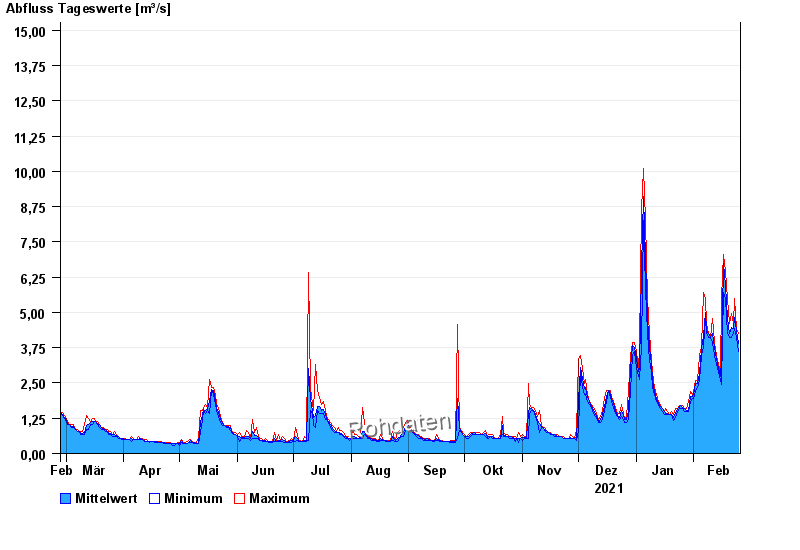
Chart of year Oberhammer / Untere Steinach
Discharge from 26.02.2021 to 25.02.2022
- 24.12.1967 Abfluss: 26,6 m³/s
- 28.01.2002 Abfluss: 21,4 m³/s
- 10.03.1981 Abfluss: 21,1 m³/s
- 30.12.1986 Abfluss: 20,1 m³/s
- 01.11.1998 Abfluss: 19,5 m³/s
| Date | Mean value [m³/s] | Maximum [m³/s] | Minimum [m³/s] |
|---|---|---|---|
| 25.02.2022 | 3.91 | 4.27 | 3.62 |
| 24.02.2022 | 4.35 | 4.44 | 4.1 |
| 23.02.2022 | 4.81 | 5.5 | 4.44 |
| 22.02.2022 | 4.44 | 4.61 | 4.27 |
| 21.02.2022 | 4.45 | 4.96 | 4.1 |
| 20.02.2022 | 4.24 | 4.61 | 4.1 |
| 19.02.2022 | 4.8 | 5.5 | 4.27 |
© Bayerisches Landesamt für Umwelt 2024