
- Start >
- Rivers >
- Discharge >
- Oberer Main - Elbe >
- Oberhammer >
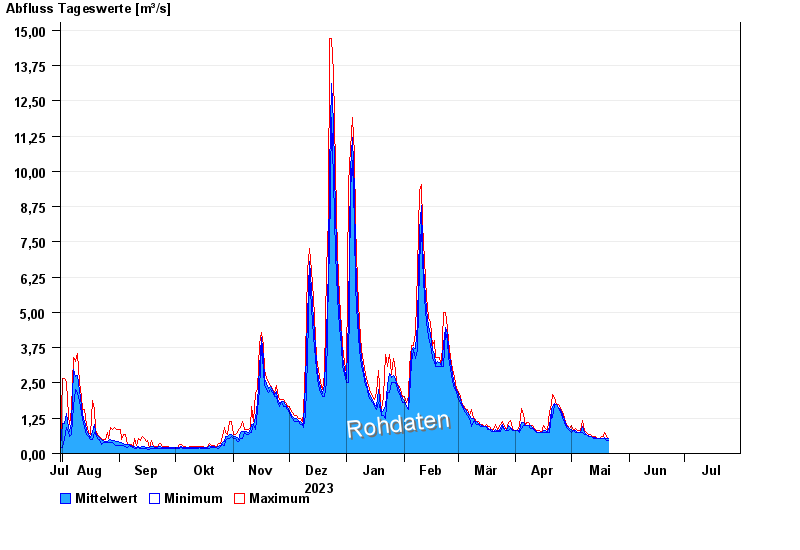
- Chart of year

Chart of year Oberhammer / Untere Steinach
Discharge from 31.07.2023 to 30.07.2024
| Date | Mean value [m³/s] | Maximum [m³/s] | Minimum [m³/s] |
|---|---|---|---|
| 04.06.2024 | 2.69 | 3.01 | 2.47 |
| 03.06.2024 | 3.21 | 3.45 | 3.01 |
| 02.06.2024 | 3.31 | 4.55 | 2.22 |
| 01.06.2024 | 1.62 | 3.15 | 0.81 |
| 31.05.2024 | 0.88 | 1.09 | 0.81 |
| 30.05.2024 | 1.02 | 1.28 | 0.731 |
| 29.05.2024 | 0.745 | 0.81 | 0.731 |
© Bayerisches Landesamt für Umwelt 2024