
- Start >
- Rivers >
- Discharge >
- Oberer Main - Elbe >
- Oberhammer >
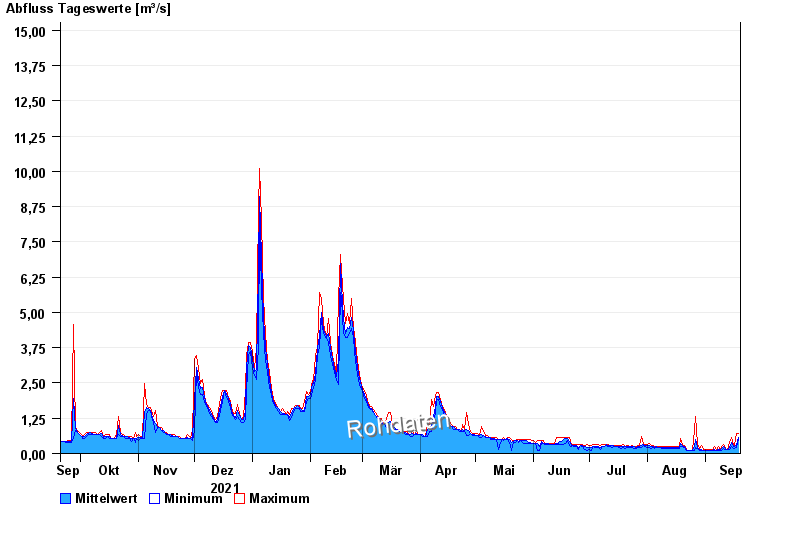
- Chart of year

Chart of year Oberhammer / Untere Steinach
Discharge from 20.09.2021 to 19.09.2022
- 24.12.1967 Abfluss: 26,6 m³/s
- 28.01.2002 Abfluss: 21,4 m³/s
- 10.03.1981 Abfluss: 21,1 m³/s
- 30.12.1986 Abfluss: 20,1 m³/s
- 01.11.1998 Abfluss: 19,5 m³/s
| Date | Mean value [m³/s] | Maximum [m³/s] | Minimum [m³/s] |
|---|---|---|---|
| 19.09.2022 | 0.572 | 0.722 | 0.5 |
| 18.09.2022 | 0.319 | 0.722 | 0.222 |
| 17.09.2022 | 0.242 | 0.291 | 0.194 |
| 16.09.2022 | 0.241 | 0.291 | 0.194 |
| 15.09.2022 | 0.398 | 0.569 | 0.255 |
| 14.09.2022 | 0.228 | 0.382 | 0.128 |
| 13.09.2022 | 0.143 | 0.148 | 0.128 |
© Bayerisches Landesamt für Umwelt 2024