
- Start >
- Rivers >
- Discharge >
- Oberer Main - Elbe >
- Oberhammer >
- Chart of total period

Chart of total period Oberhammer / Untere Steinach
Discharge from 01.11.1957 to 26.04.2024
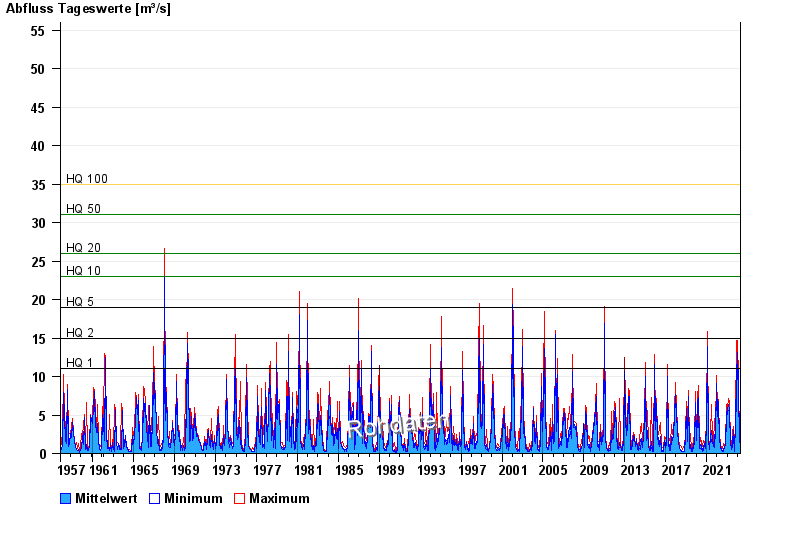
- HQ1 11 m³/s
- HQ2 15 m³/s
- HQ5 19 m³/s
- HQ10 23 m³/s
- HQ20 26 m³/s
- HQ50 31 m³/s
- HQ100 35 m³/s
| Date | Mean value [m³/s] | Maximum [m³/s] | Minimum [m³/s] |
|---|---|---|---|
| 26.04.2024 | 1.46 | 1.5 | 1.39 |
| 25.04.2024 | 1.57 | 1.61 | 1.5 |
| 24.04.2024 | 1.62 | 1.74 | 1.61 |
| 23.04.2024 | 1.74 | 1.74 | 1.74 |
| 22.04.2024 | 1.76 | 1.98 | 1.74 |
| 21.04.2024 | 1.62 | 2.09 | 1.28 |
| 20.04.2024 | 1.55 | 1.74 | 1.39 |
© Bayerisches Landesamt für Umwelt 2024