
- Start >
- Rivers >
- Discharge >
- Oberer Main - Elbe >
- Neukenroth >
- Chart of year

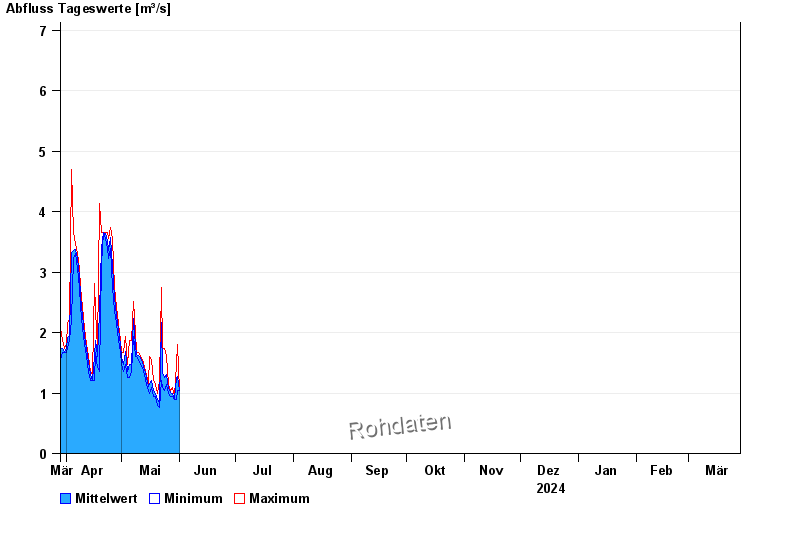
Chart of year Neukenroth / Haßlach
Discharge from 29.03.2024 to 28.03.2025
- 24.12.1967 Abfluss: 88,2 m³/s
- 10.03.1981 Abfluss: 84,1 m³/s
- 27.01.2002 Abfluss: 70,3 m³/s
- 03.01.2003 Abfluss: 66 m³/s
- 03.03.1999 Abfluss: 62,2 m³/s
| Date | Mean value [m³/s] | Maximum [m³/s] | Minimum [m³/s] |
|---|---|---|---|
| 20.05.2024 | 0.935 | 0.99 | 0.892 |
| 19.05.2024 | 0.992 | 1.14 | 0.94 |
| 18.05.2024 | 1.04 | 1.2 | 0.94 |
| 17.05.2024 | 1.21 | 1.55 | 1.09 |
| 16.05.2024 | 1.14 | 1.6 | 0.99 |
| 15.05.2024 | 1.11 | 1.14 | 1.04 |
| 14.05.2024 | 1.25 | 1.31 | 1.14 |
© Bayerisches Landesamt für Umwelt 2024