
- Start >
- Rivers >
- Discharge >
- Oberer Main - Elbe >
- Muggendorf >
- Chart of year

Chart of year Muggendorf / Wiesent
Discharge from 21.04.2018 to 20.04.2019
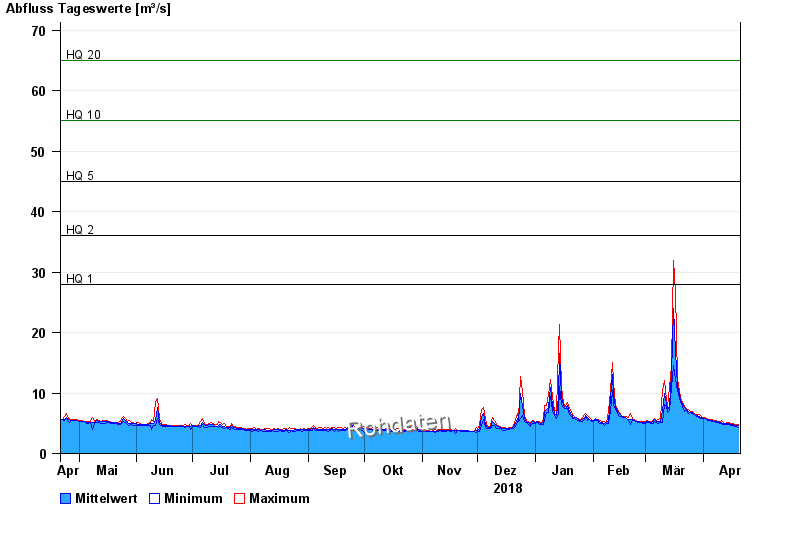
- HQ1 28 m³/s
- HQ2 36 m³/s
- HQ5 45 m³/s
- HQ10 55 m³/s
- HQ20 65 m³/s
- HQ50 80 m³/s
- HQ100 90 m³/s
| Date | Mean value [m³/s] | Maximum [m³/s] | Minimum [m³/s] |
|---|---|---|---|
| 20.04.2019 | 4.62 | 4.76 | 4.34 |
| 19.04.2019 | 4.65 | 4.82 | 4.53 |
| 18.04.2019 | 4.7 | 4.83 | 4.53 |
| 17.04.2019 | 4.77 | 4.89 | 4.59 |
| 16.04.2019 | 4.86 | 4.93 | 4.63 |
| 15.04.2019 | 4.92 | 5.09 | 4.81 |
| 14.04.2019 | 4.94 | 5.13 | 4.82 |
© Bayerisches Landesamt für Umwelt 2024