
- Start >
- Rivers >
- Discharge >
- Oberer Main - Elbe >
- Muggendorf >
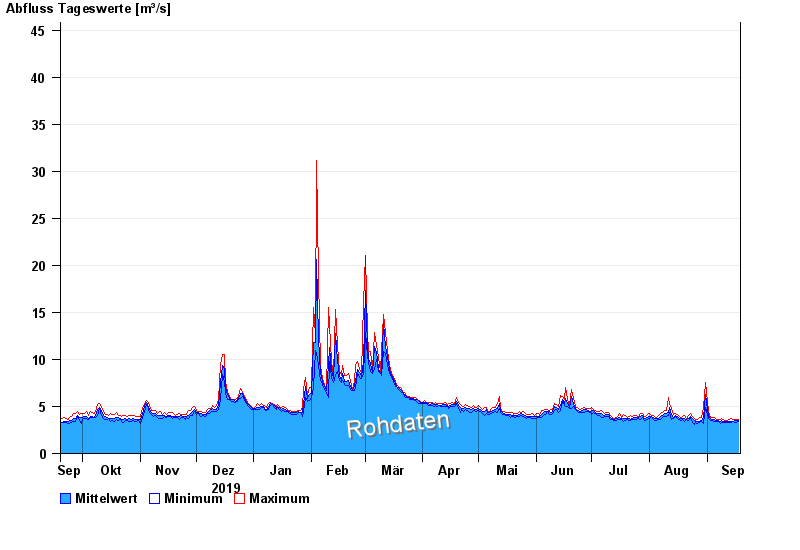
- Chart of year

Chart of year Muggendorf / Wiesent
Discharge from 19.09.2019 to 18.09.2020
- 01.03.1947 Abfluss: 140 m³/s
- 26.01.1995 Abfluss: 111 m³/s
- 01.03.1956 Abfluss: 110 m³/s
- 14.01.2011 Abfluss: 61,2 m³/s
- 23.01.1995 Abfluss: 61,2 m³/s
| Date | Mean value [m³/s] | Maximum [m³/s] | Minimum [m³/s] |
|---|---|---|---|
| 18.09.2020 | 3.46 | 3.6 | 3.35 |
| 17.09.2020 | 3.48 | 3.66 | 3.3 |
| 16.09.2020 | 3.47 | 3.64 | 3.27 |
| 15.09.2020 | 3.45 | 3.62 | 3.36 |
| 14.09.2020 | 3.42 | 3.72 | 3.25 |
| 13.09.2020 | 3.37 | 3.57 | 3.32 |
| 12.09.2020 | 3.42 | 3.56 | 3.3 |
© Bayerisches Landesamt für Umwelt 2024