
- Start >
- Rivers >
- Discharge >
- Oberer Main - Elbe >
- Muggendorf >
- Chart of year

Chart of year Muggendorf / Wiesent
Discharge from 27.10.2020 to 26.10.2021
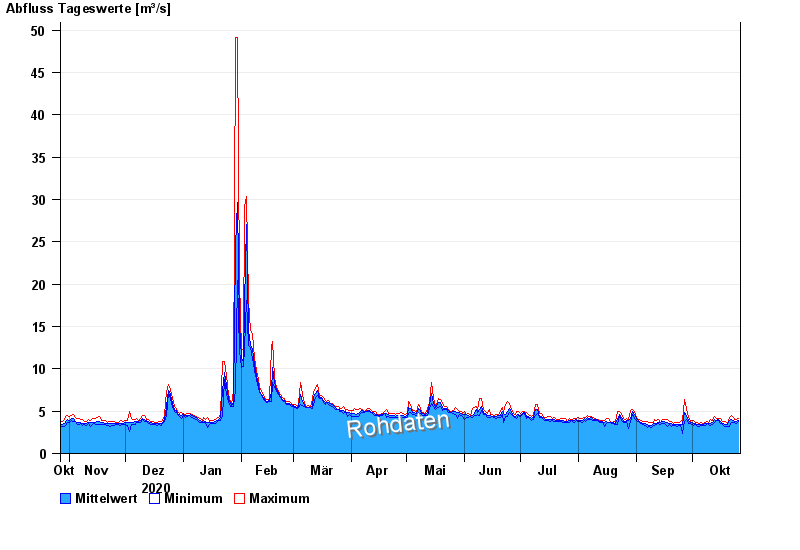
| Date | Mean value [m³/s] | Maximum [m³/s] | Minimum [m³/s] |
|---|---|---|---|
| 26.10.2021 | 3.94 | 4.16 | 3.83 |
| 25.10.2021 | 3.81 | 4.04 | 3.6 |
| 24.10.2021 | 3.76 | 4.06 | 3.62 |
| 23.10.2021 | 3.87 | 4.21 | 3.62 |
| 22.10.2021 | 4.07 | 4.52 | 3.61 |
| 21.10.2021 | 3.86 | 4.3 | 3.15 |
| 20.10.2021 | 3.37 | 3.56 | 3.21 |
© Bayerisches Landesamt für Umwelt 2024