
- Start >
- Rivers >
- Discharge >
- Oberer Main - Elbe >
- Muggendorf >
- Chart of year

Chart of year Muggendorf / Wiesent
Discharge from 21.10.2020 to 20.10.2021
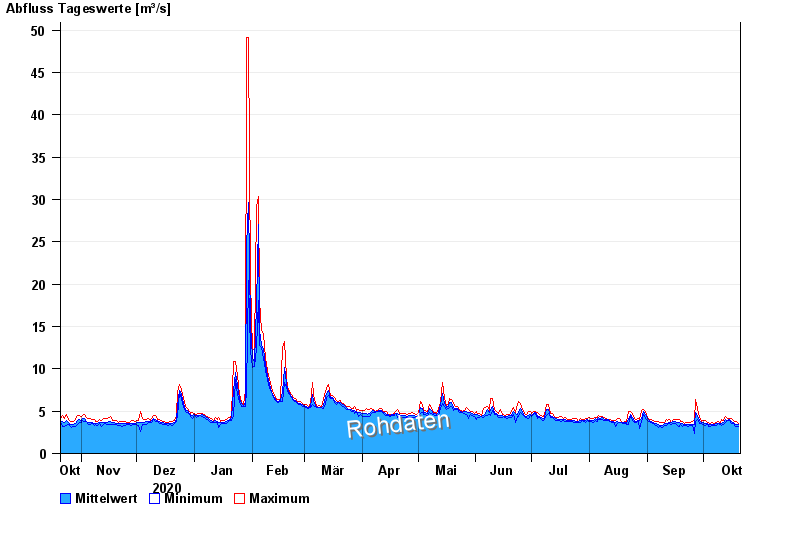
| Date | Mean value [m³/s] | Maximum [m³/s] | Minimum [m³/s] |
|---|---|---|---|
| 20.10.2021 | 3.37 | 3.56 | 3.21 |
| 19.10.2021 | 3.46 | 3.73 | 3.23 |
| 18.10.2021 | 3.54 | 3.8 | 3.32 |
| 17.10.2021 | 3.65 | 3.88 | 3.53 |
| 16.10.2021 | 3.8 | 4.08 | 3.53 |
| 15.10.2021 | 3.96 | 4.15 | 3.85 |
| 14.10.2021 | 3.93 | 4.13 | 3.84 |
© Bayerisches Landesamt für Umwelt 2024