
- Start >
- Rivers >
- Discharge >
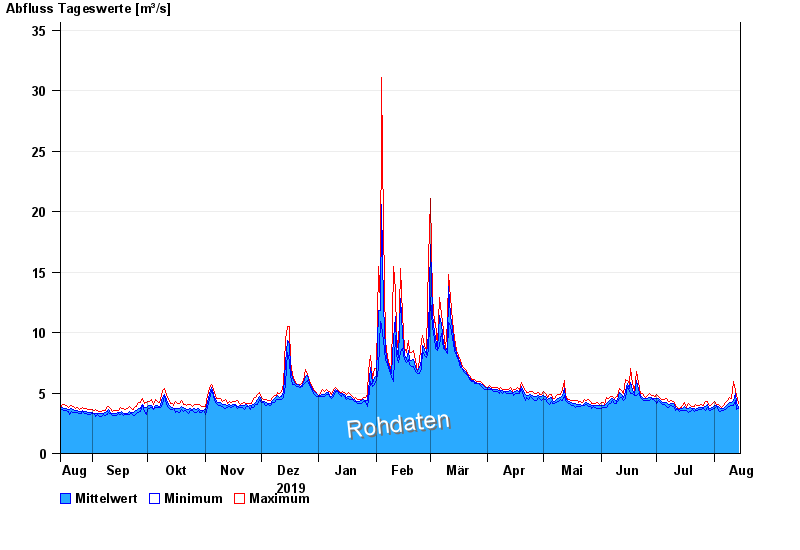
- Oberer Main - Elbe >
- Muggendorf >
- Chart of year

Chart of year Muggendorf / Wiesent
Discharge from 15.08.2019 to 14.08.2020
| Date | Mean value [m³/s] | Maximum [m³/s] | Minimum [m³/s] |
|---|---|---|---|
| 14.08.2020 | 3.84 | 4.15 | 3.76 |
| 13.08.2020 | 4.1 | 4.82 | 3.63 |
| 12.08.2020 | 4.93 | 5.25 | 4.35 |
| 11.08.2020 | 4.41 | 5.97 | 4.01 |
| 10.08.2020 | 4.24 | 4.53 | 3.96 |
| 09.08.2020 | 4.2 | 4.6 | 3.89 |
| 08.08.2020 | 4.05 | 4.4 | 3.82 |
© Bayerisches Landesamt für Umwelt 2024