
- Start >
- Rivers >
- Discharge >
- Oberer Main - Elbe >
- Muggendorf >
- Chart of year

Chart of year Muggendorf / Wiesent
Discharge from 31.10.2019 to 30.10.2020
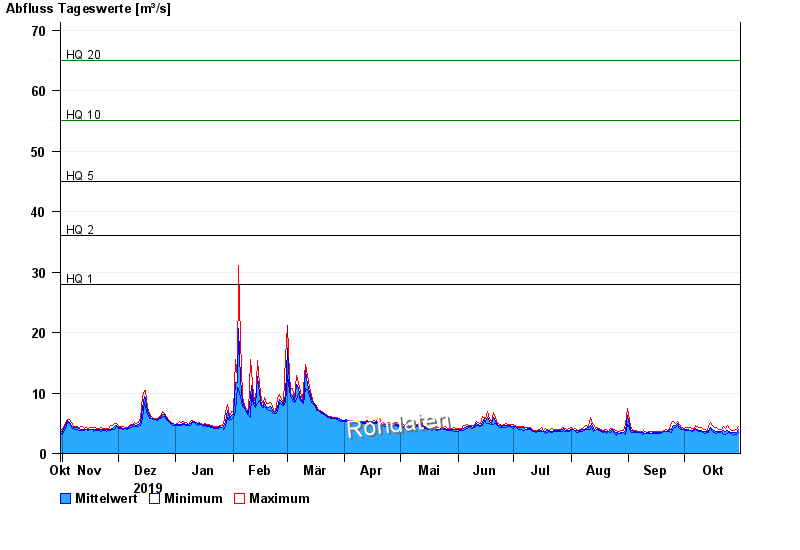
- HQ1 28 m³/s
- HQ2 36 m³/s
- HQ5 45 m³/s
- HQ10 55 m³/s
- HQ20 65 m³/s
- HQ50 80 m³/s
- HQ100 90 m³/s
| Date | Mean value [m³/s] | Maximum [m³/s] | Minimum [m³/s] |
|---|---|---|---|
| 30.10.2020 | 3.91 | 4.47 | 3.43 |
| 29.10.2020 | 3.55 | 4.05 | 3.19 |
| 28.10.2020 | 3.44 | 3.77 | 3.17 |
| 27.10.2020 | 3.41 | 3.75 | 3.05 |
| 26.10.2020 | 3.46 | 3.86 | 3.25 |
| 25.10.2020 | 3.68 | 4.07 | 3.41 |
| 24.10.2020 | 3.87 | 4.56 | 3.3 |
© Bayerisches Landesamt für Umwelt 2024