
- Start >
- Rivers >
- Discharge >
- Oberer Main - Elbe >
- Muggendorf >
- Chart of year

Chart of year Muggendorf / Wiesent
Discharge from 24.01.2020 to 23.01.2021
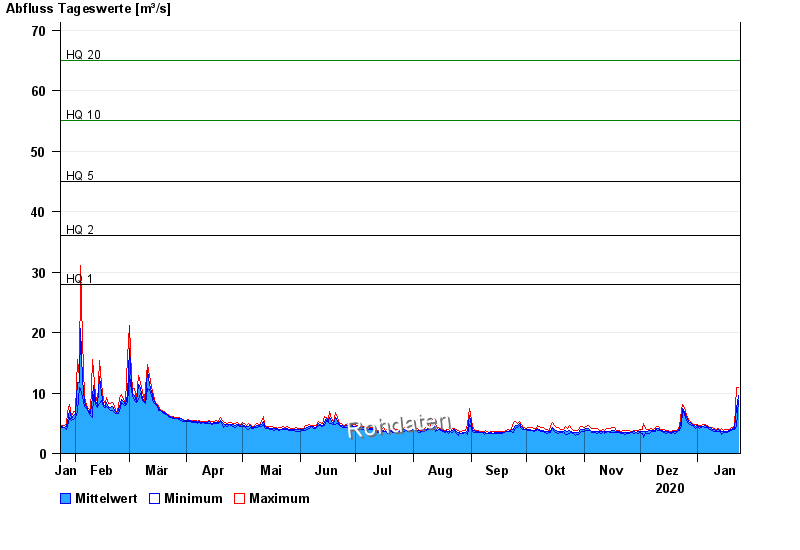
- HQ1 28 m³/s
- HQ2 36 m³/s
- HQ5 45 m³/s
- HQ10 55 m³/s
- HQ20 65 m³/s
- HQ50 80 m³/s
- HQ100 90 m³/s
| Date | Mean value [m³/s] | Maximum [m³/s] | Minimum [m³/s] |
|---|---|---|---|
| 23.01.2021 | 9.6 | 10.9 | 8.76 |
| 22.01.2021 | 7.48 | 10.9 | 4.41 |
| 21.01.2021 | 4.21 | 4.55 | 3.95 |
| 20.01.2021 | 4.06 | 4.22 | 3.91 |
| 19.01.2021 | 3.92 | 4.29 | 3.74 |
| 18.01.2021 | 3.73 | 4 | 3.58 |
| 17.01.2021 | 3.69 | 3.92 | 3.55 |
© Bayerisches Landesamt für Umwelt 2024