
- Start >
- Rivers >
- Discharge >
- Oberer Main - Elbe >
- Muggendorf >
- Chart of year

Chart of year Muggendorf / Wiesent
Discharge from 07.04.2020 to 06.04.2021
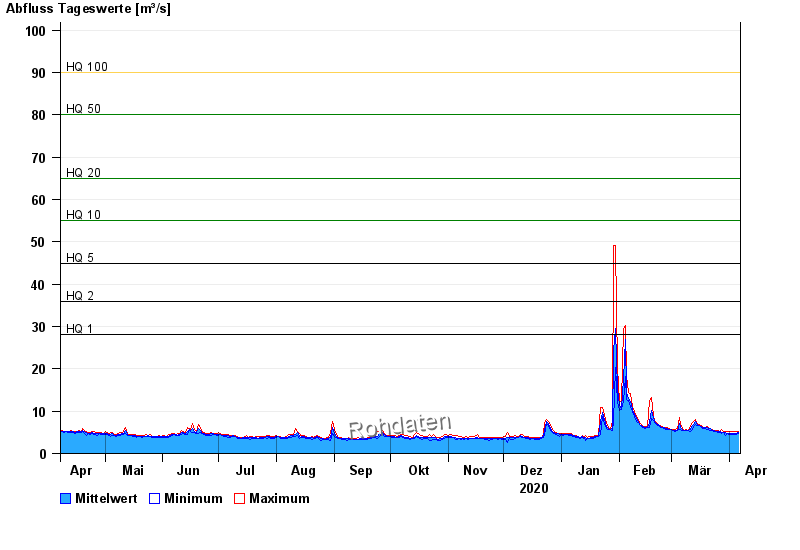
- HQ1 28 m³/s
- HQ2 36 m³/s
- HQ5 45 m³/s
- HQ10 55 m³/s
- HQ20 65 m³/s
- HQ50 80 m³/s
- HQ100 90 m³/s
| Date | Mean value [m³/s] | Maximum [m³/s] | Minimum [m³/s] |
|---|---|---|---|
| 06.04.2021 | 4.98 | 5.31 | 4.71 |
| 05.04.2021 | 4.69 | 5.16 | 4.42 |
| 04.04.2021 | 4.66 | 5.14 | 4.41 |
| 03.04.2021 | 4.7 | 5.29 | 4.4 |
| 02.04.2021 | 4.71 | 5.12 | 4.39 |
| 01.04.2021 | 4.77 | 5.12 | 4.38 |
| 31.03.2021 | 4.82 | 5.1 | 4.65 |
© Bayerisches Landesamt für Umwelt 2024