
- Start >
- Rivers >
- Discharge >
- Oberer Main - Elbe >
- Muggendorf >
- Chart of year

Chart of year Muggendorf / Wiesent
Discharge from 06.07.2019 to 05.07.2020
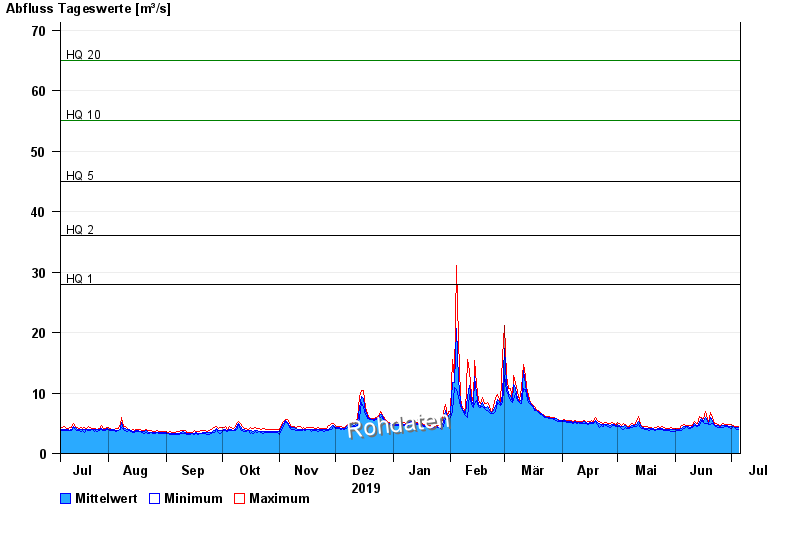
- HQ1 28 m³/s
- HQ2 36 m³/s
- HQ5 45 m³/s
- HQ10 55 m³/s
- HQ20 65 m³/s
- HQ50 80 m³/s
- HQ100 90 m³/s
| Date | Mean value [m³/s] | Maximum [m³/s] | Minimum [m³/s] |
|---|---|---|---|
| 05.07.2020 | 4.24 | 4.43 | 4.03 |
| 04.07.2020 | 4.24 | 4.48 | 4.05 |
| 03.07.2020 | 4.35 | 4.52 | 4.21 |
| 02.07.2020 | 4.54 | 4.69 | 4.39 |
| 01.07.2020 | 4.52 | 4.85 | 4.17 |
| 30.06.2020 | 4.51 | 4.75 | 4.34 |
| 29.06.2020 | 4.56 | 4.79 | 4.49 |
© Bayerisches Landesamt für Umwelt 2024