
- Start >
- Rivers >
- Discharge >
- Oberer Main - Elbe >
- Mönchröden >
- Chart of year

Chart of year Mönchröden / Röden
Discharge from 03.08.2020 to 02.08.2021
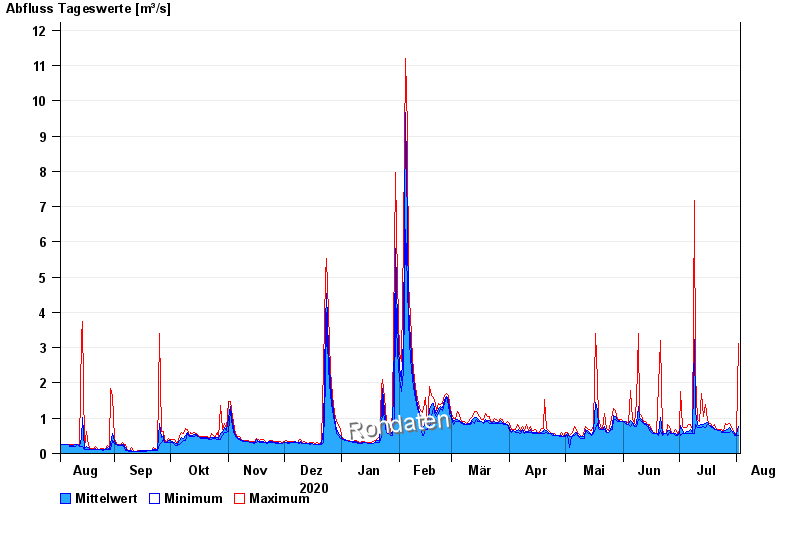
| Date | Mean value [m³/s] | Maximum [m³/s] | Minimum [m³/s] |
|---|---|---|---|
| 02.08.2021 | 0.774 | 3.13 | 0.515 |
| 01.08.2021 | 0.546 | 0.558 | 0.515 |
| 31.07.2021 | 0.556 | 0.558 | 0.515 |
| 30.07.2021 | 0.614 | 0.642 | 0.558 |
| 29.07.2021 | 0.657 | 0.725 | 0.642 |
| 28.07.2021 | 0.729 | 0.861 | 0.6 |
| 27.07.2021 | 0.671 | 0.815 | 0.6 |
© Bayerisches Landesamt für Umwelt 2024