
- Start >
- Rivers >
- Discharge >
- Oberer Main - Elbe >
- Michelfeld >
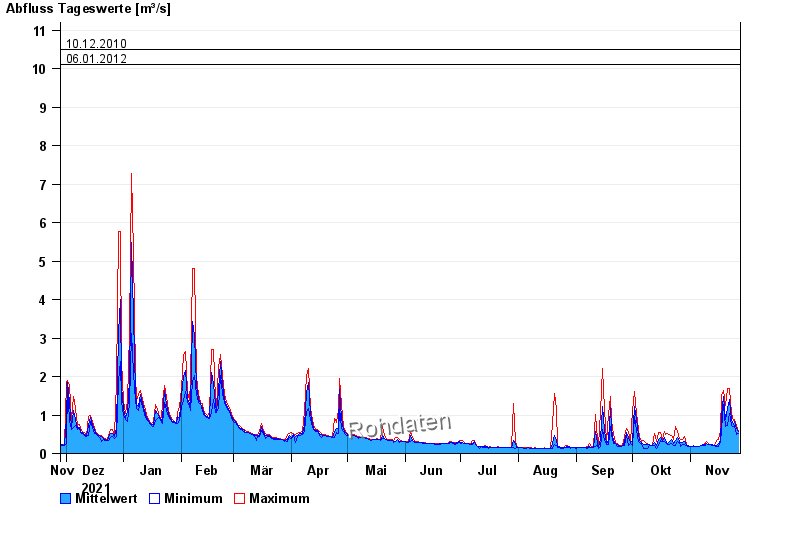
- Chart of year

Chart of year Michelfeld / Pegnitz
Discharge from 28.11.2021 to 27.11.2022
- 09.01.2011 Abfluss: 20,3 m³/s
- 14.01.2011 Abfluss: 19,2 m³/s
- 17.12.2011 Abfluss: 14,6 m³/s
- 10.12.2010 Abfluss: 10,5 m³/s
- 06.01.2012 Abfluss: 10,1 m³/s
| Date | Mean value [m³/s] | Maximum [m³/s] | Minimum [m³/s] |
|---|---|---|---|
| 27.11.2022 | 0.56 | 0.574 | 0.521 |
| 26.11.2022 | 0.65 | 0.734 | 0.494 |
| 25.11.2022 | 0.824 | 0.889 | 0.734 |
| 24.11.2022 | 0.76 | 0.866 | 0.708 |
| 23.11.2022 | 0.845 | 1.05 | 0.734 |
| 22.11.2022 | 1.4 | 1.69 | 1.05 |
| 21.11.2022 | 1.16 | 1.69 | 0.734 |
© Bayerisches Landesamt für Umwelt 2024