
- Start >
- Rivers >
- Discharge >
- Oberer Main - Elbe >
- Michelfeld >
- Chart of year

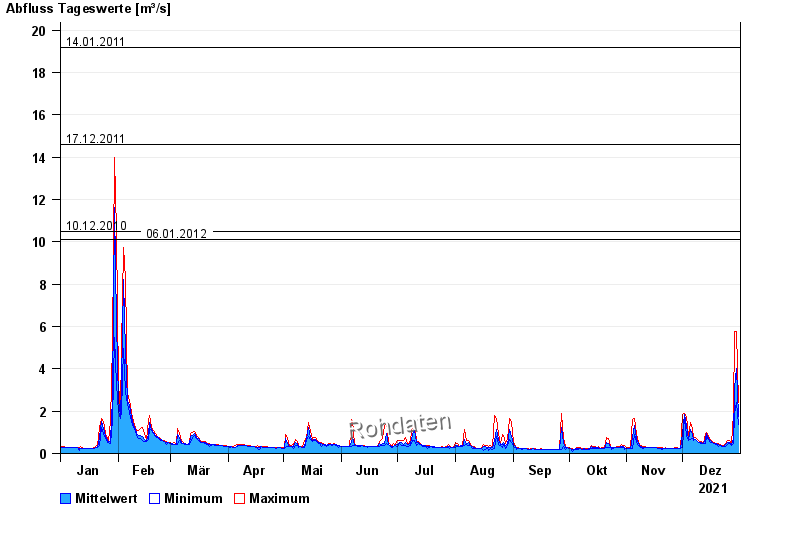
Chart of year Michelfeld / Pegnitz
Discharge from 01.01.2021 to 31.12.2021
- 09.01.2011 Abfluss: 17,9 m³/s
- 14.01.2011 Abfluss: 16,8 m³/s
- 03.01.2003 Abfluss: 15,9 m³/s
- 13.02.2005 Abfluss: 15,1 m³/s
- 09.06.2002 Abfluss: 15,1 m³/s
| Date | Mean value [m³/s] | Maximum [m³/s] | Minimum [m³/s] |
|---|---|---|---|
| 31.12.2021 | 1.74 | 2.39 | 1.36 |
| 30.12.2021 | 4 | 5.76 | 2.39 |
| 29.12.2021 | 3.14 | 5.76 | 1.87 |
| 28.12.2021 | 0.686 | 1.87 | 0.449 |
| 27.12.2021 | 0.437 | 0.477 | 0.395 |
| 26.12.2021 | 0.512 | 0.611 | 0.449 |
| 25.12.2021 | 0.508 | 0.611 | 0.422 |
© Bayerisches Landesamt für Umwelt 2024