
- Start >
- Rivers >
- Discharge >
- Oberer Main - Elbe >
- Michelfeld >
- Chart of year

Chart of year Michelfeld / Pegnitz
Discharge from 10.02.2023 to 09.02.2024
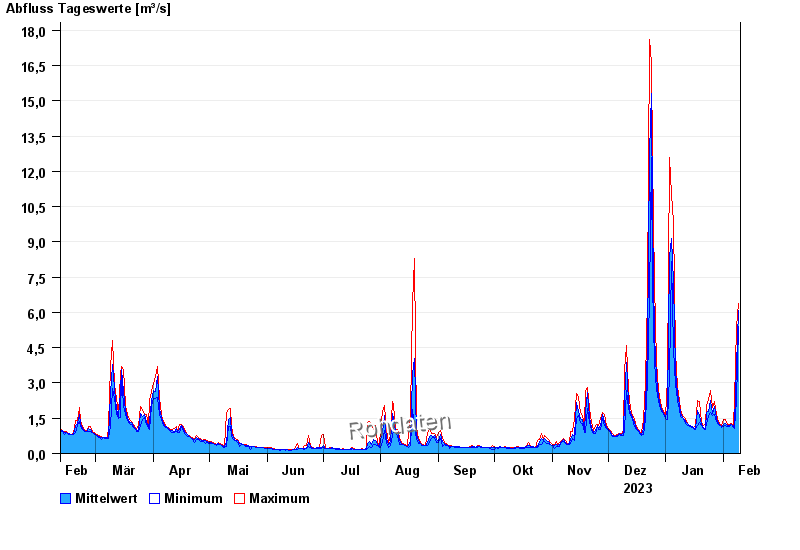
| Date | Mean value [m³/s] | Maximum [m³/s] | Minimum [m³/s] |
|---|---|---|---|
| 09.02.2024 | 6.07 | 6.39 | 5.41 |
| 08.02.2024 | 3.74 | 5.41 | 2.27 |
| 07.02.2024 | 1.29 | 2.27 | 1.07 |
| 06.02.2024 | 1.14 | 1.22 | 1.1 |
| 05.02.2024 | 1.25 | 1.27 | 1.22 |
| 04.02.2024 | 1.17 | 1.22 | 1.15 |
| 03.02.2024 | 1.19 | 1.25 | 1.15 |
© Bayerisches Landesamt für Umwelt 2024