
- Start >
- Rivers >
- Discharge >
- Oberer Main - Elbe >
- Marktleuthen >
- Chart of year

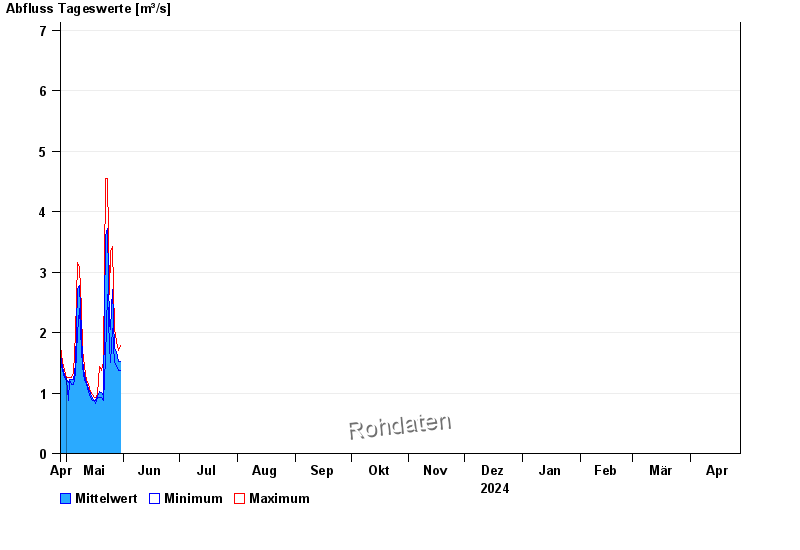
Chart of year Marktleuthen / Eger
Discharge from 28.04.2024 to 27.04.2025
- 28.05.2006 Abfluss: 63,2 m³/s
- 28.12.1947 Abfluss: 61,4 m³/s
- 08.02.1946 Abfluss: 56,4 m³/s
- 04.11.1940 Abfluss: 55,2 m³/s
- 24.12.1967 Abfluss: 46,7 m³/s
| Date | Mean value [m³/s] | Maximum [m³/s] | Minimum [m³/s] |
|---|---|---|---|
| 08.05.2024 | 2.87 | 3.07 | 2.55 |
| 07.05.2024 | 2.71 | 3.16 | 1.99 |
| 06.05.2024 | 1.47 | 1.99 | 1.32 |
| 05.05.2024 | 1.23 | 1.32 | 1.14 |
| 04.05.2024 | 1.22 | 1.26 | 1.14 |
| 03.05.2024 | 1.22 | 1.26 | 1.2 |
| 02.05.2024 | 1.17 | 1.26 | 0.871 |
© Bayerisches Landesamt für Umwelt 2024