
- Start >
- Rivers >
- Discharge >
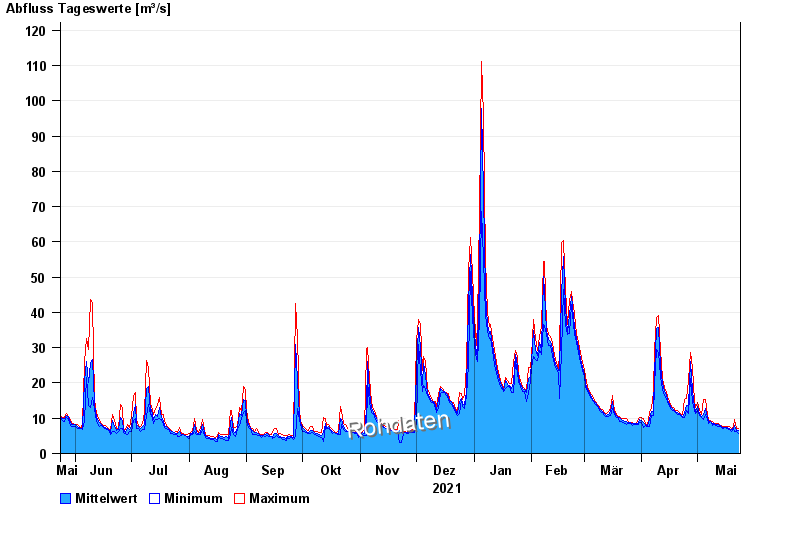
- Oberer Main - Elbe >
- Mainleus >
- Chart of year

Chart of year Mainleus / Main
Discharge from 24.05.2021 to 23.05.2022
| Date | Mean value [m³/s] | Maximum [m³/s] | Minimum [m³/s] |
|---|---|---|---|
| 23.05.2022 | 6.53 | 7.08 | 5.64 |
| 22.05.2022 | 6.58 | 7.08 | 6.19 |
| 21.05.2022 | 7.9 | 9.62 | 6.19 |
| 20.05.2022 | 7.21 | 7.33 | 7.08 |
| 19.05.2022 | 6.82 | 7.08 | 6.19 |
| 18.05.2022 | 7.18 | 7.64 | 6.76 |
| 17.05.2022 | 7.46 | 7.64 | 7.08 |
© Bayerisches Landesamt für Umwelt 2024