
- Start >
- Rivers >
- Discharge >
- Oberer Main - Elbe >
- Mainleus >
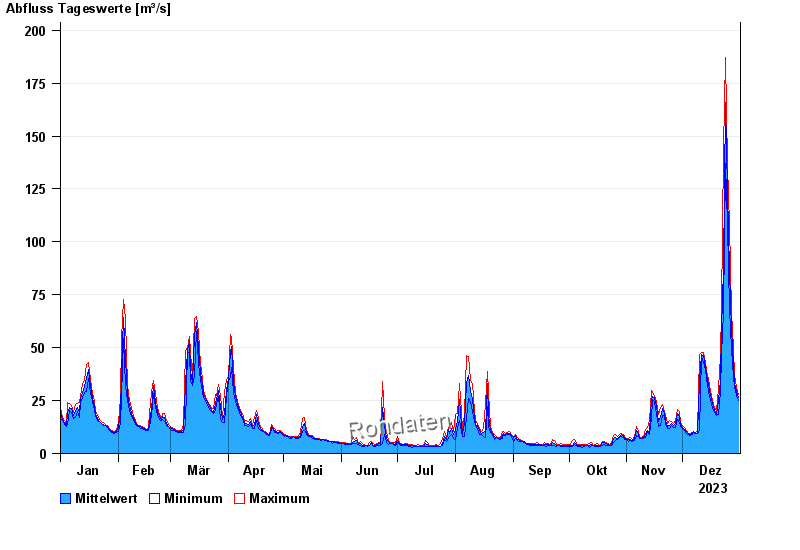
- Chart of year

Chart of year Mainleus / Main
Discharge from 01.01.2023 to 31.12.2023
| Date | Mean value [m³/s] | Maximum [m³/s] | Minimum [m³/s] |
|---|---|---|---|
| 31.12.2023 | 26.4 | 28 | 25.1 |
| 30.12.2023 | 29.3 | 31.4 | 27.5 |
| 29.12.2023 | 33.7 | 36.9 | 31.4 |
| 28.12.2023 | 42.2 | 49.8 | 35.9 |
| 27.12.2023 | 58.5 | 67.3 | 49.8 |
| 26.12.2023 | 86.3 | 108 | 68 |
| 25.12.2023 | 124 | 136 | 108 |
© Bayerisches Landesamt für Umwelt 2024