
- Start >
- Rivers >
- Discharge >
- Oberer Main - Elbe >
- Lorenzreuth >
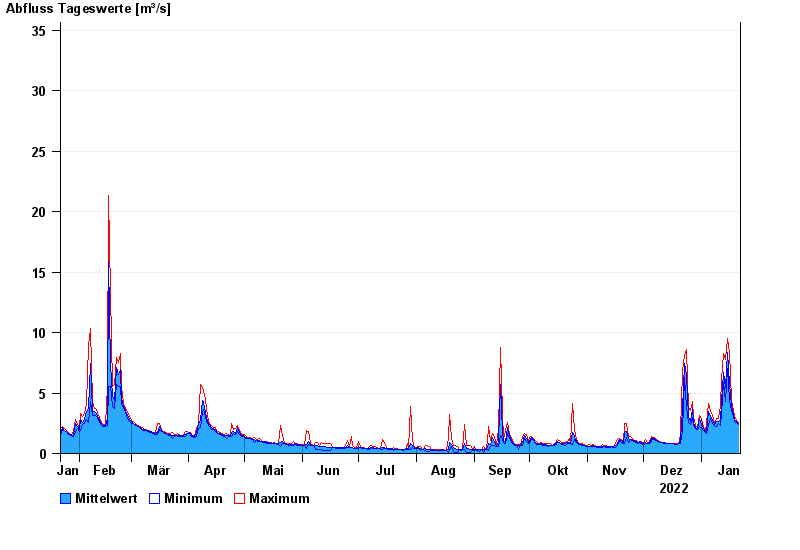
- Chart of year

Chart of year Lorenzreuth / Röslau
Discharge from 22.01.2022 to 21.01.2023
- 28.05.2006 Abfluss: 62,8 m³/s
- 12.02.2005 Abfluss: 45,9 m³/s
- 01.11.1998 Abfluss: 45,8 m³/s
- 03.01.2003 Abfluss: 44,6 m³/s
- 07.12.2007 Abfluss: 37,9 m³/s
| Date | Mean value [m³/s] | Maximum [m³/s] | Minimum [m³/s] |
|---|---|---|---|
| 21.01.2023 | 2.03 | 2.13 | 1.97 |
| 20.01.2023 | 2.2 | 2.28 | 2.13 |
| 19.01.2023 | 2.41 | 2.61 | 2.28 |
| 18.01.2023 | 2.79 | 3.03 | 2.61 |
| 17.01.2023 | 3.43 | 3.85 | 3.03 |
| 16.01.2023 | 5.17 | 7.58 | 3.85 |
| 15.01.2023 | 7.6 | 8.73 | 6.36 |
© Bayerisches Landesamt für Umwelt 2024