
- Start >
- Rivers >
- Discharge >
- Oberer Main - Elbe >
- Lorenzreuth >
- Chart of year

Chart of year Lorenzreuth / Röslau
Discharge from 03.02.2023 to 02.02.2024
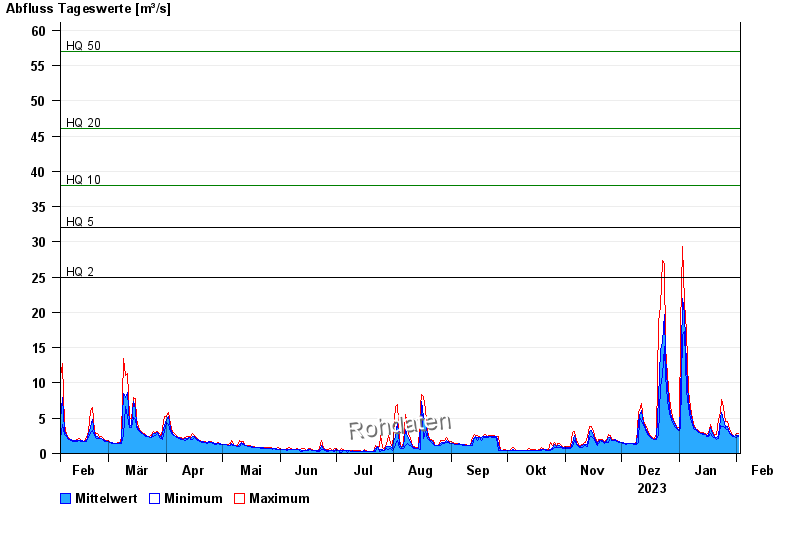
- HQ2 25 m³/s
- HQ5 32 m³/s
- HQ10 38 m³/s
- HQ20 46 m³/s
- HQ50 57 m³/s
- HQ100 64 m³/s
| Date | Mean value [m³/s] | Maximum [m³/s] | Minimum [m³/s] |
|---|---|---|---|
| 02.02.2024 | 2.55 | 2.82 | 2.48 |
| 01.02.2024 | 2.59 | 2.82 | 2.32 |
| 31.01.2024 | 2.46 | 2.48 | 2.4 |
| 30.01.2024 | 2.49 | 2.57 | 2.4 |
| 29.01.2024 | 2.65 | 2.82 | 2.57 |
| 28.01.2024 | 3 | 3.34 | 2.82 |
| 27.01.2024 | 3.87 | 4.47 | 3.34 |
© Bayerisches Landesamt für Umwelt 2024