
- Start >
- Rivers >
- Discharge >
- Oberer Main - Elbe >
- Lohr >
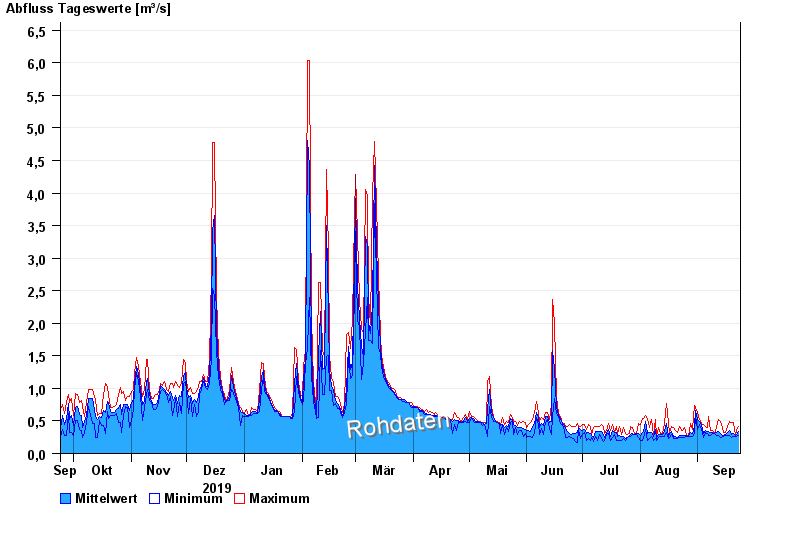
- Chart of year

Chart of year Lohr / Baunach
Discharge from 24.09.2019 to 23.09.2020
| Date | Mean value [m³/s] | Maximum [m³/s] | Minimum [m³/s] |
|---|---|---|---|
| 23.09.2020 | 0.332 | 0.421 | 0.284 |
| 22.09.2020 | 0.286 | 0.351 | 0.262 |
| 21.09.2020 | 0.272 | 0.284 | 0.262 |
| 20.09.2020 | 0.31 | 0.469 | 0.262 |
| 19.09.2020 | 0.299 | 0.469 | 0.241 |
| 18.09.2020 | 0.349 | 0.493 | 0.284 |
| 17.09.2020 | 0.315 | 0.421 | 0.284 |
© Bayerisches Landesamt für Umwelt 2024