
- Start >
- Rivers >
- Discharge >
- Oberer Main - Elbe >
- Lohr >
- Chart of year

Chart of year Lohr / Baunach
Discharge from 09.08.2020 to 08.08.2021
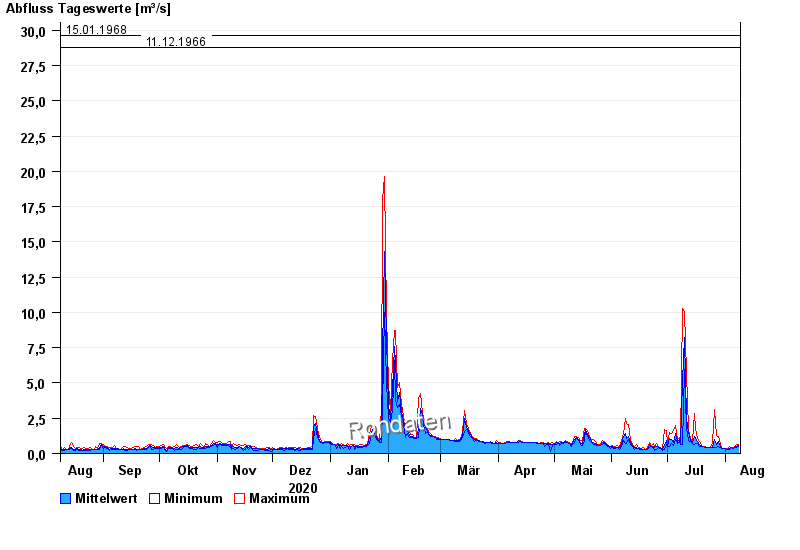
- 07.05.1969 Abfluss: 44 m³/s
- 24.12.1967 Abfluss: 35 m³/s
- 06.12.1965 Abfluss: 34,8 m³/s
- 15.01.1968 Abfluss: 29,6 m³/s
- 11.12.1966 Abfluss: 28,8 m³/s
| Date | Mean value [m³/s] | Maximum [m³/s] | Minimum [m³/s] |
|---|---|---|---|
| 08.08.2021 | 0.554 | 0.617 | 0.488 |
| 07.08.2021 | 0.492 | 0.617 | 0.406 |
| 06.08.2021 | 0.441 | 0.469 | 0.406 |
| 05.08.2021 | 0.388 | 0.406 | 0.367 |
| 04.08.2021 | 0.432 | 0.446 | 0.406 |
| 03.08.2021 | 0.361 | 0.488 | 0.289 |
| 02.08.2021 | 0.316 | 0.348 | 0.309 |
© Bayerisches Landesamt für Umwelt 2024