
- Start >
- Rivers >
- Discharge >
- Oberer Main - Elbe >
- Leucherhof >
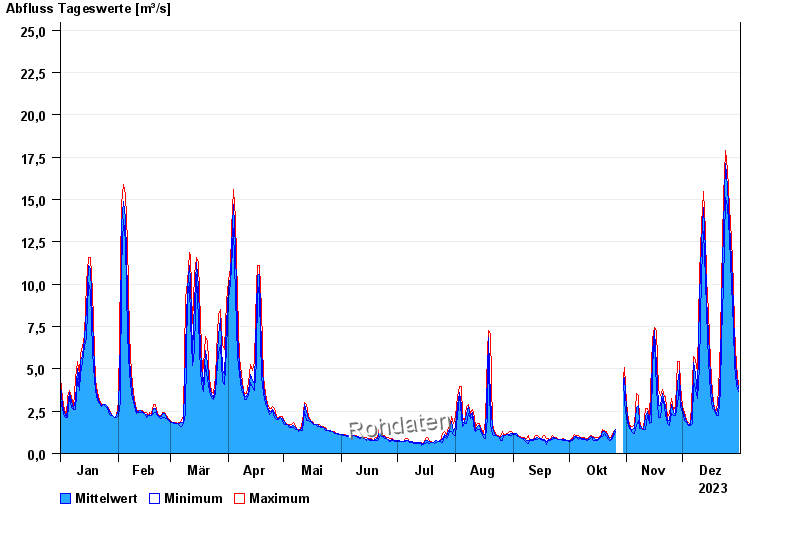
- Chart of year

Chart of year Leucherhof / Baunach
Discharge from 01.01.2023 to 31.12.2023
- 26.06.1933 Abfluss: 76 m³/s
- 22.11.1930 Abfluss: 65 m³/s
- 08.01.2011 Abfluss: 62,8 m³/s
- 10.10.1930 Abfluss: 58 m³/s
- 14.01.2011 Abfluss: 54,5 m³/s
| Date | Mean value [m³/s] | Maximum [m³/s] | Minimum [m³/s] |
|---|---|---|---|
| 31.12.2023 | 3.85 | 4.03 | 3.68 |
| 30.12.2023 | 4.58 | 5.19 | 4.03 |
| 29.12.2023 | 6.12 | 7.46 | 5.19 |
| 28.12.2023 | 8.69 | 10 | 7.46 |
| 27.12.2023 | 11.4 | 12.7 | 10 |
| 26.12.2023 | 13.6 | 14.5 | 12.7 |
| 25.12.2023 | 15.7 | 16.8 | 14.6 |
© Bayerisches Landesamt für Umwelt 2024