
- Start >
- Rivers >
- Discharge >
- Oberer Main - Elbe >
- Laufermühle >
- Chart of year

Chart of year Laufermühle / Aisch
Discharge from 01.01.2018 to 31.12.2018
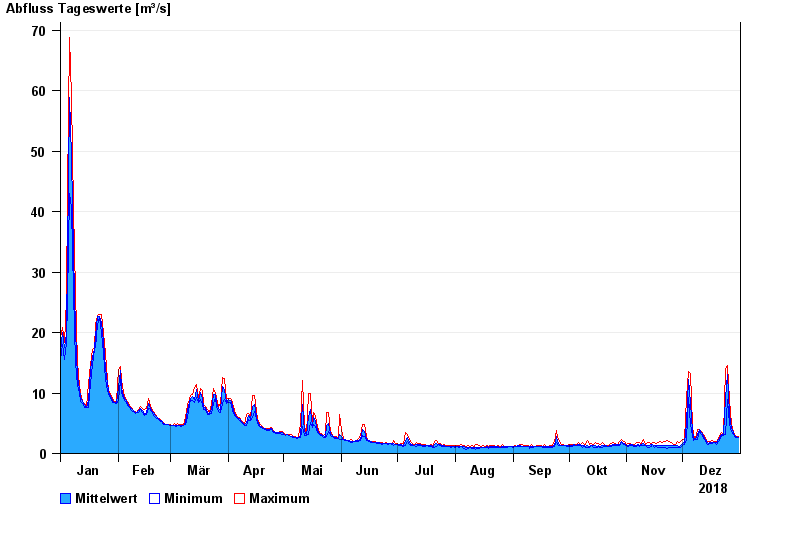
| Date | Mean value [m³/s] | Maximum [m³/s] | Minimum [m³/s] |
|---|---|---|---|
| 31.12.2018 | 2.72 | 2.87 | 2.63 |
| 30.12.2018 | 2.73 | 2.87 | 2.57 |
| 29.12.2018 | 2.92 | 3.18 | 2.75 |
| 28.12.2018 | 3.45 | 3.69 | 3.18 |
| 27.12.2018 | 4.14 | 4.86 | 3.69 |
| 26.12.2018 | 6.52 | 8.89 | 4.86 |
| 25.12.2018 | 13 | 14.5 | 8.89 |
© Bayerisches Landesamt für Umwelt 2024