
- Start >
- Rivers >
- Discharge >
- Oberer Main - Elbe >
- Laufermühle >
- Chart of year

Chart of year Laufermühle / Aisch
Discharge from 28.02.2024 to 27.02.2025
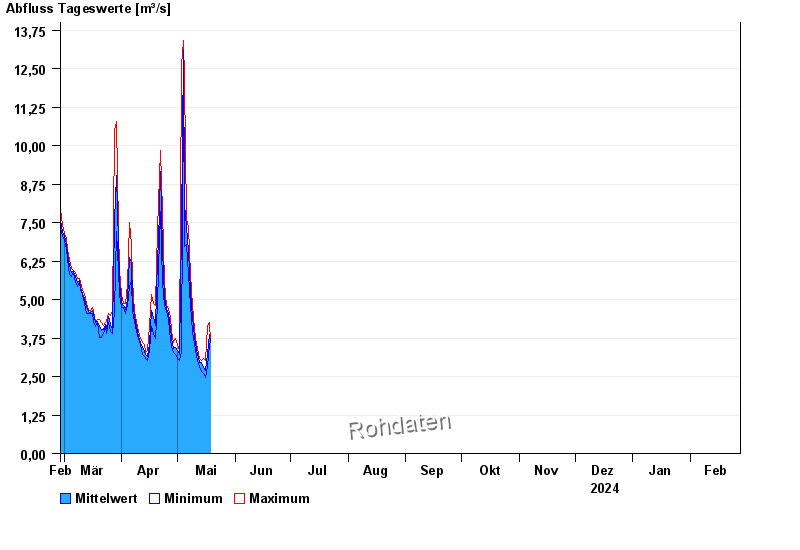
| Date | Mean value [m³/s] | Maximum [m³/s] | Minimum [m³/s] |
|---|---|---|---|
| 05.05.2024 | 9.18 | 12.1 | 7.35 |
| 04.05.2024 | 13.1 | 13.4 | 12.2 |
| 03.05.2024 | 7.31 | 12.6 | 3.28 |
| 02.05.2024 | 3.22 | 3.33 | 3.03 |
| 01.05.2024 | 3.33 | 3.53 | 3.09 |
| 30.04.2024 | 3.43 | 3.72 | 3.21 |
| 29.04.2024 | 3.42 | 3.59 | 3.28 |
© Bayerisches Landesamt für Umwelt 2024